View AFA group data
In addition to user-defined groups, AFA includes a built-in group called ALL_FIREWALLS. This group consists of all devices in the system, and you can generate reports for it like any other group.
For more details, see Manage groups.
Note: For additional information on Cisco User Awareness – How to Define a User/User Group in a Rule, see this AlgoPedia Knowledge Base article.
Viewing User-Defined Groups
To view a user-defined group:
-
In the main menu, click
 Groups.
The Groups menu appears in the main menu, displaying all of the groups defined in AFA.
-
(Optional) Filter the device tree to locate your group.
Filter by whole or partial name:
-
In the Search field, type part or all of the group to search for.
-
Press enter or click
 to display matching results in the device tree.
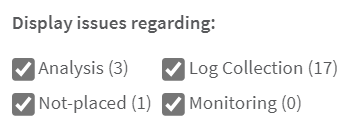
Filter by issues found:
Groups for which the last report generation failed appear in red. Groups for which real-time monitoring or log collection have failed appear in orange.
-
To filter / show only groups containing issues, click Issues.
The tree shows only groups containing issues.
-
-
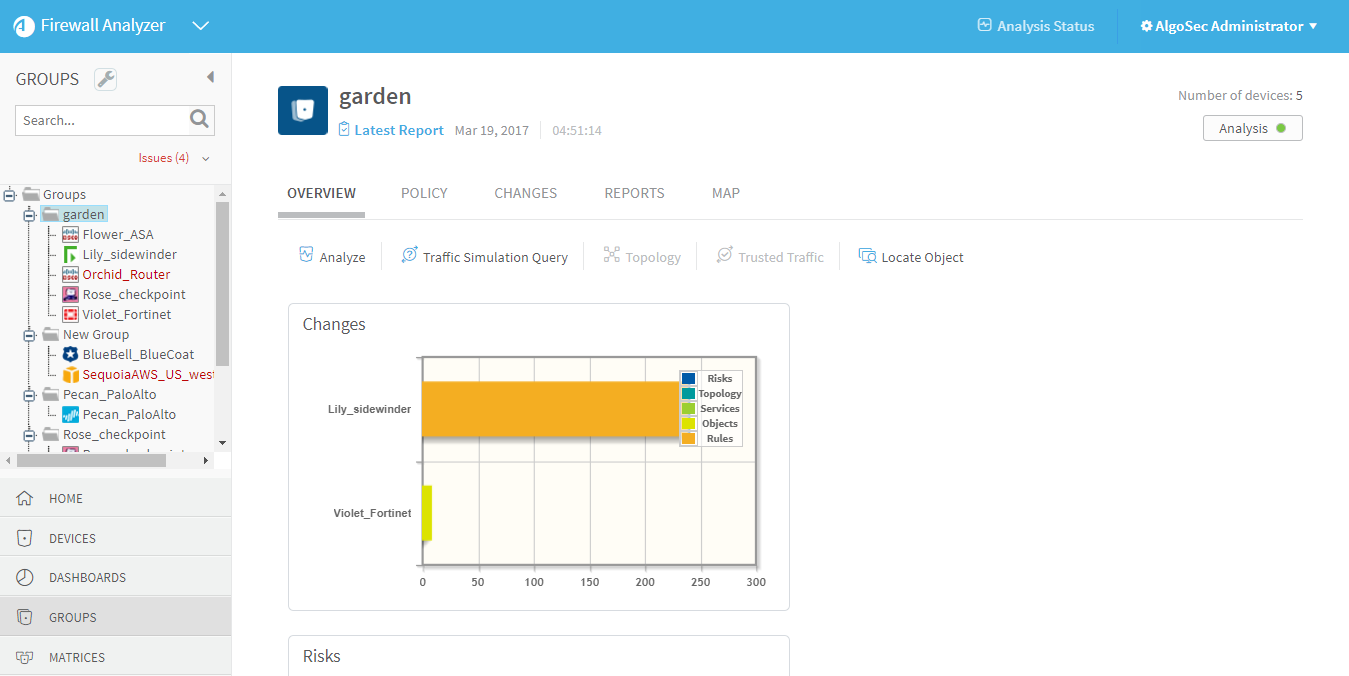
Select the required group.
The group appears in the workspace.
For details of the information displayed at the top of the workspace, see Group Information Fields.
You can view the individual devices in the group by selecting them in the in the menu.
|
This field... |
Displays this... |
|---|---|
|
Latest Report |
A button that brings you to the last successful report generated for this group. |
|
Date and Time |
The date and time when the group was last analyzed. |
|
Number Of devices |
The number of devices in the group. |
Viewing the ALL_FIREWALLS Group
To view the ALL_FIREWALLS group:
-
Click Devices in the main menu.
The Devices menu appears in the main menu, displaying all of the devices defined in AFA. Devices for which the last report generation failed appear in red. Devices for which real-time monitoring or log collection have failed appear in orange.
-
In the devices list, click ALL_FIREWALLS.
The ALL_FIREWALLS group appears in the workspace.
For information on the fields displayed at the top of the workspace, see Group Information Fields.
Viewing Group Reports
Group reports provide information for a group of devices. Group reports are provided for the ALL_FIREWALLS group and for groups manually defined in AFA.
AFA provides the following options for viewing group reports:
To view the latest report for a group:
-
View the desired group. For details, see Viewing User-Defined Groups.
The Overview tab displays a preview of the latest report for the group.
The color of the
 ,
,  , and
, and  icons at the top of the page signify the status of their last process:
- Red. The last process failed.
- Green. The last process succeeded.
- Gray. The process has never run.
If the last analysis failed, see or an analysis is in progress, see Managing Analyses for more information.
- When the last analysis succeeded, view the report by do one of the following:
At the top of the workspace, click
 .
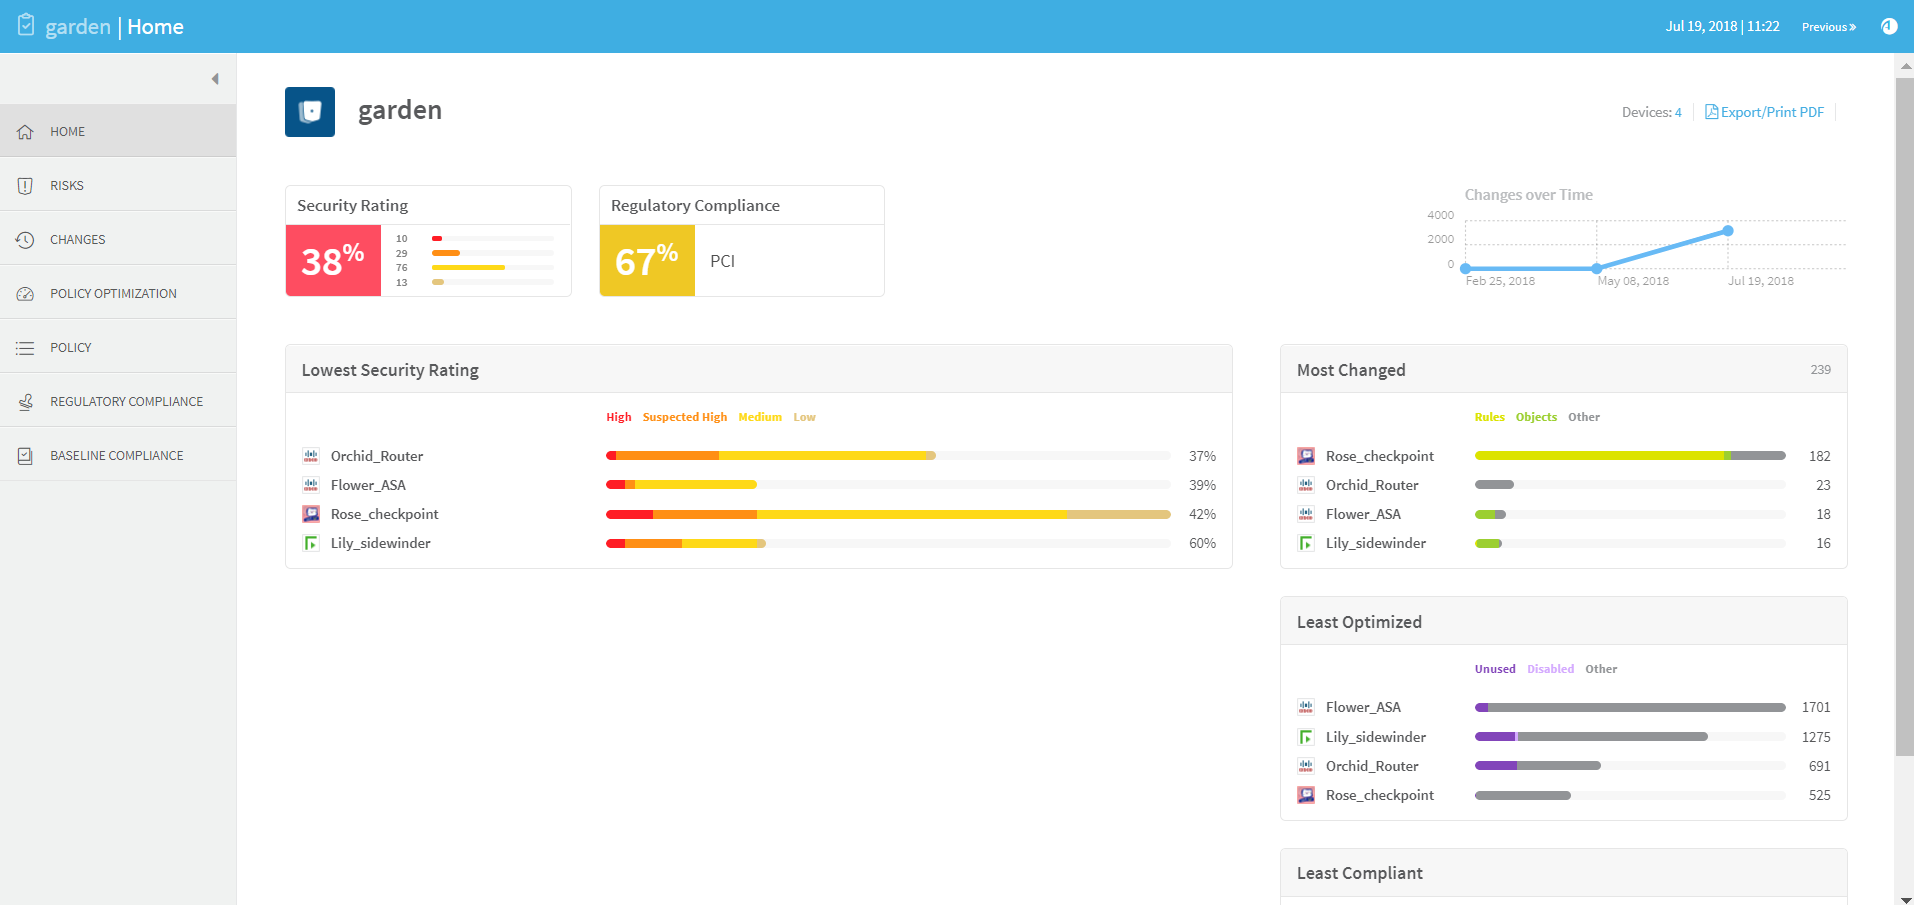
.The latest report opens, displaying the report's Home page in the workspace.
Within the Overview tab, click on the report section you want to view.
The latest report opens, displaying the specified section in the workspace.
The report menu appears in the left pane, and the selected page appears in the workspace. You can navigate between the different pages of the report by selecting the page in the report menu. For information on each of the various report pages, see Group report pages.
All report pages are structured to allow drilling down from a high-level overview to low-level, detailed information. Any item that appears underlined when you hover over it can be clicked for further details.
- When the last analysis succeeded, you can view support files for it by doing the following:
Click the Analysis button.
The support files link appears.

- Click the link.
To view or download any available report for a group:
- View the desired group. For details, see Viewing User-Defined Groups.
-
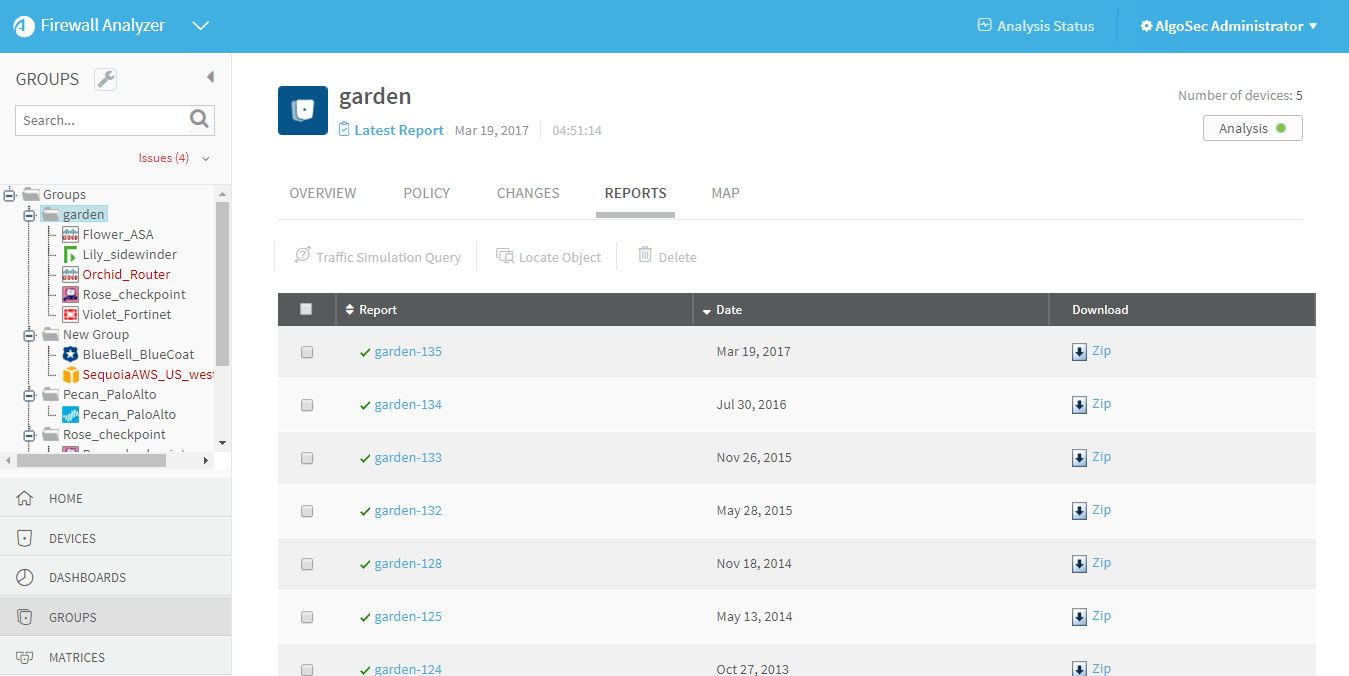
Click the Reports tab.
The Reports tab appears, displaying all of the available reports for the group.
Reports that were successfully generated are marked with a
 . Reports that are currently being generated are marked with a
  . Reports for which generation failed are marked with a
  .
. - Do one of the following:
- To view a report without downloading it, in the Report column, click on the desired report's name.
- To download a report to your computer, in the desired report's row, click Zip.
The compressed report downloads to your computer. Unzip the report to view it.
The report opens, displaying the Home page.
The report menu appears in the left pane, and the selected page appears in the workspace. You can navigate between the different pages of the report by selecting the page in the report menu. For information on each of the various report pages, see Group report pages.
All report pages are structured to allow drilling down from a high-level overview to low-level, detailed information. Any item that appears underlined when you hover over it can be clicked for further details.
Group report page references
The following pages are available in group reports:
|
Page |
Description |
|---|---|
|
Provides a general overview of the report, including a list of devices in the group, changes to the devices, risks, and policy optimization. |
|
|
Provides a high-level executive summary of the risk analysis findings. Note: Available only with the AFA Risk and Compliance Module |
|
|
Access a variety of automatically-filled compliance reports for this group. Note: Available only with the AFA Risk and Compliance Module |
|
|
Find out what you can eliminate from each device's policy to optimize it and make it more efficient and maintainable. |
|
|
Indicates whether group members' configurations comply with certain baselines. |
|
|
Provides access to the wealth of detailed information collected and identified during the analysis. |
|
|
Displays the changes in rules, objects, and the resulting changes in allowed traffic and risks, over all the history of AFA reports for devices in this group. |
 .
.


