View AFA device data
This topic describes how to view and work with the device data displayed in AFA.
AFA's device tree
Many devices supported by AFA are actually a system of devices in a hierarchy that work together. Each device defined in AFA is represented as a node in the tree, and any physical or virtual devices it manages appear as sub-nodes.
Tip: By default, the device tree is collapsed. This is controlled by the parameter CollapseDevicesTreeOnLogin=yes. To configure tree to be expanded by default, set CollapseDevicesTreeOnLogin=no. See CollapseDevicesTreeOnLogin.
AFA enables you to manage and view data for each individual node or parent nodes. Reports at a parent level aggregate all analysis information for each of the sub-devices. Running an analysis on a parent node also updates data for each of the children.
Palo Alto Networks Panorama devices also display the device's group. Click the link to open a list of all device groups.
Additionally, Palo Alto Networks Panorama devices and any Juniper SRX devices that are configured to display virtual routers, VRs appear as the last tier in the device tree.
-
In this case, AFA provides reports for each VR under each VSYS/LSYS. Although the VSYS/LSYS analysis aggregates the data for each child VR, it does not contain the full VR tier data, as is usually the case for parent reports.
-
Data for individual VRs include topology and routing information, and the risky rules associated with the traffic they route. These reports should be consulted to troubleshoot routing issues, or to view risky rules. All other data, such as policy optimization recommendations, is in the VSYS/LSYS reports.
Note: This behavior is not relevant to Juniper Netscreen or NSM devices configured to display virtual routers. Netscreen devices are not sub-devices of a virtual system, and are displayed as parallel.
View a specific device
To view data for a specific device, do the following:
-
In the main menu, click
 Devices.
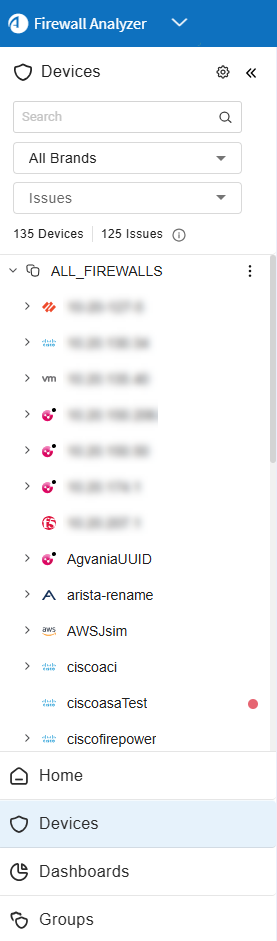
The device tree appears in the main menu, displaying all of the devices defined in AFA.
-
(Optional) Filter the device tree to locate your device.
Filter by whole or partial name:
-
In the Search field, type the brand or device to search for.
-
Press enter or click
 to display matching results in the device tree.
Filter by vendor brand:
-
Click the All Brands dropdown.
-
Select a brand from a list of available vendors to display in the device tree.
Note: To expand or collapse the device tree, click
 located to the right of ALL_FIREWALLS in the tree. This opens open a dropdown with Expand All and Collapse All options.
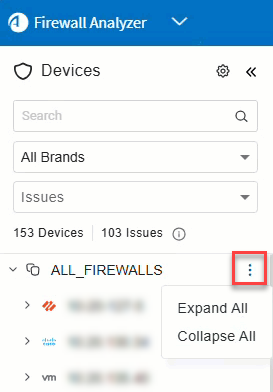
Tip: By default, the device tree is collapsed. This is controlled by the parameter CollapseDevicesTreeOnLogin=yes. To configure tree to be expanded by default, set CollapseDevicesTreeOnLogin=no. See CollapseDevicesTreeOnLogin.
Filter by issues found:
Devices for which the last report generation, real-time monitoring, or log collection failed appear with a red dot next to the device name in the tree. Layer 2 devices that are not placed on the map appear with an orange dot next to the device name in the tree. For more details, see Manage Layer 2 (L2) devices in the map.) Hover over the relevant row to see a tooltip listing the issues.
-
To filter / show only devices with issues, click Issues.
The device tree shows only devices with issues and their parent nodes.
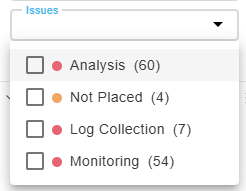
Tip: To filter by only specify issue types:
-
Click the Issues dropdown.
-
Select the check boxes of the issues you want to appear in the filtered results.
The device tree automatically expands to display the devices with the selected issues.
-
-
-
Click your device in the tree to view full details in the workspace.
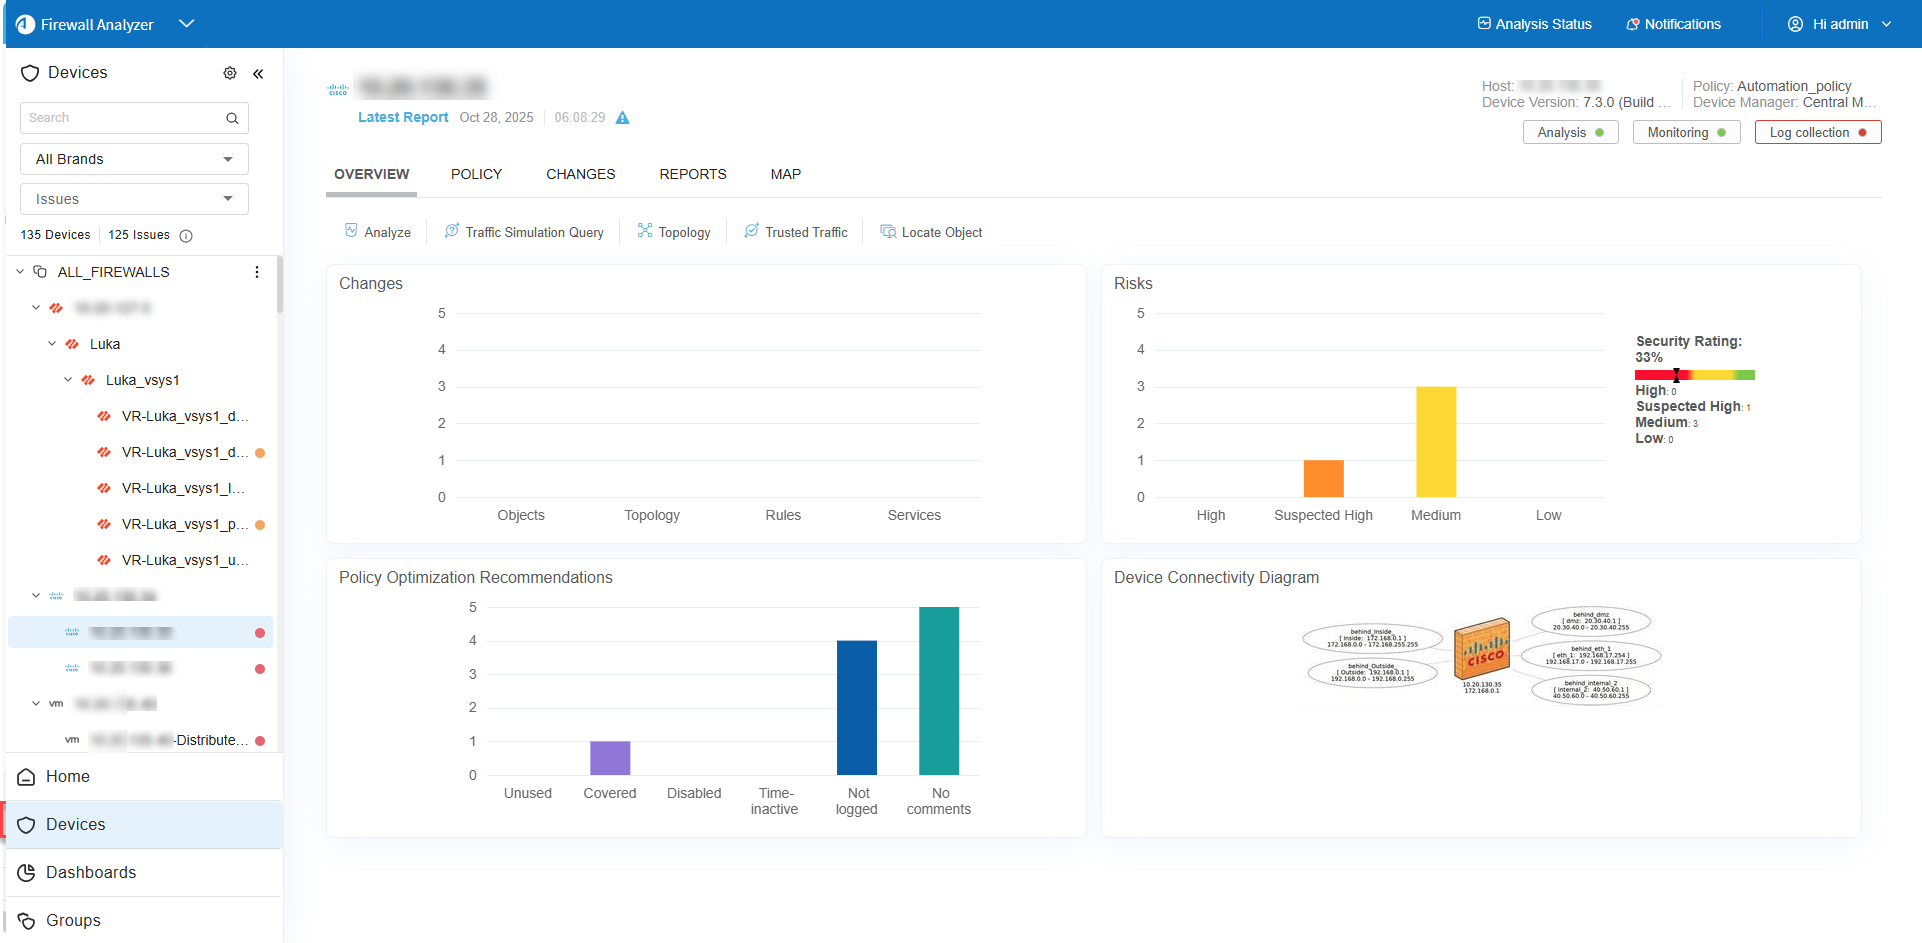
The information displayed at the top of the workspace for each device varies by its relative position in the hierarchy of the device tree.
Data displayed per device type
| All tiers |
Data displayed for all tiers includes:
|
| Parent devices |
Parent devices are also displayed with the number of devices they manage. |
| Individual devices |
The following additional data is displayed for individual devices:
|
 . Last cycle succeeded.
 . Last cycle failed.
 . Monitoring / log collection disabled.
For more details, see:
- AFA's graphic network map
- Managing Analyses
- Manage real-time monitoring
- Run traffic simulation queries
- Customize risk detection
Device data for cloud devices
AFA represents cloud "devices" with a tiered hierarchy, as follows:
-
AWS. User account > Region / VPC > Security set
-
Azure. Subscription > Region / VNet > Security set
-
Google Cloud. Organization > Project > VPC > Firewall policy
Note: Data collection for Google Cloud is done via ASMS.
In AFA, AWS and Azure policies are grouped into security sets. Security sets are groups of instances, ALBs, or VMs with the exact same security group and network ACLs or subnet security groups applied. Each instance, ALB, or VM in a security set has identical security policies.
Details shown for each cloud device varies at each tier, and you can manage each tier individually, such as running analysis on a specific tier only. Reports for "parent" tiers appear as group reports, and when an analysis is run on a "parent" tier, reports are automatically generated for each tier below it. For more details, see View AFA group data.
Cloud data per tier
The following details are presented at all tiers:
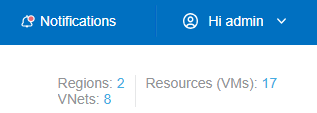
The following additional data is presented for the top two tiers only (account / subscription and region / VPC / VNet):
- The number of regions with the tier.
- The number of VPCs or VNets in the tier.
- The number of instances, ALBs, or VMs in the tier.
Click the linked number to open a full list of items. For example:
The following information is presented at the security set tier only:
| Security group or network security group | The name of the security set's group. Click the link to show a list of the security groups and IDs. |
| Network ACLs or subnet network security group. | The name of the security set's ACLs or subnet network security group. Click the link to show a list of the security groups and IDs. |
| Region |
The name of the security set's region. |
| VNet or VPC | The name of the security set's VPC or VNet. |
| Instances, ALBs, or VMs | The number of instances, ALBs, or VMs. Click the link to open a searchable list of the instances, ALBs, or VMs and IDs. |
| Subnets | The number of subnets. Click the link to open a list of the subnets and IDs. |
| Monitoring and log collection |
The monitoring and log collection status for the specific device.
|
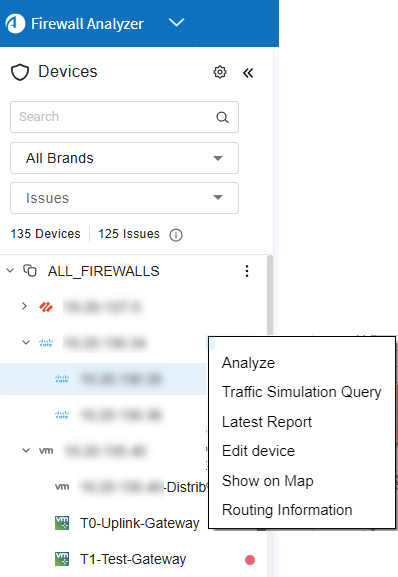
Device tree context menu
You can perform key operations quickly and efficiently straight from the Device Tree, reducing the need for multiple clicks and improving overall navigation comfort.
Access the context menu
To access the context menu, simply right-click on any device within the Device Tree. A menu appears, offering the following options:
| Option | Description |
|---|---|
|
Analyze |
Opens the Analyze dialog to start device analysis on the selected device. |
|
Traffic Simulation Query |
Opens the Traffic Simulation Query form on the selected device. |
|
Latest Report |
Opens the latest report of the selected device in a new tab. |
|
Edit Device |
Opens the Edit Device dialog to modify selected device settings. Supported for Panorama, Arista, Cisco Secure Firewall, Cisco Meraki, Juniper Space, Panorama Prisma, Versa, NSX-T |
|
Show on Map |
Displays the selected device's location on the map. |
|
Routing Information |
Opens the Routing Information dialog for the selected device in the Map tab. |
View device reports
Device reports provide details about a single device, either a device that's defined individually or the lowest tier in the device tree for a system of devices.
To view the full and latest report for a specific device:
Browse to and select a specific device
Click the Reports link at the top of the workspace.
A list of the available reports for the device is displayed.
Click on the required report.
The report opens in a separate tab. For more details, see AFA reports.
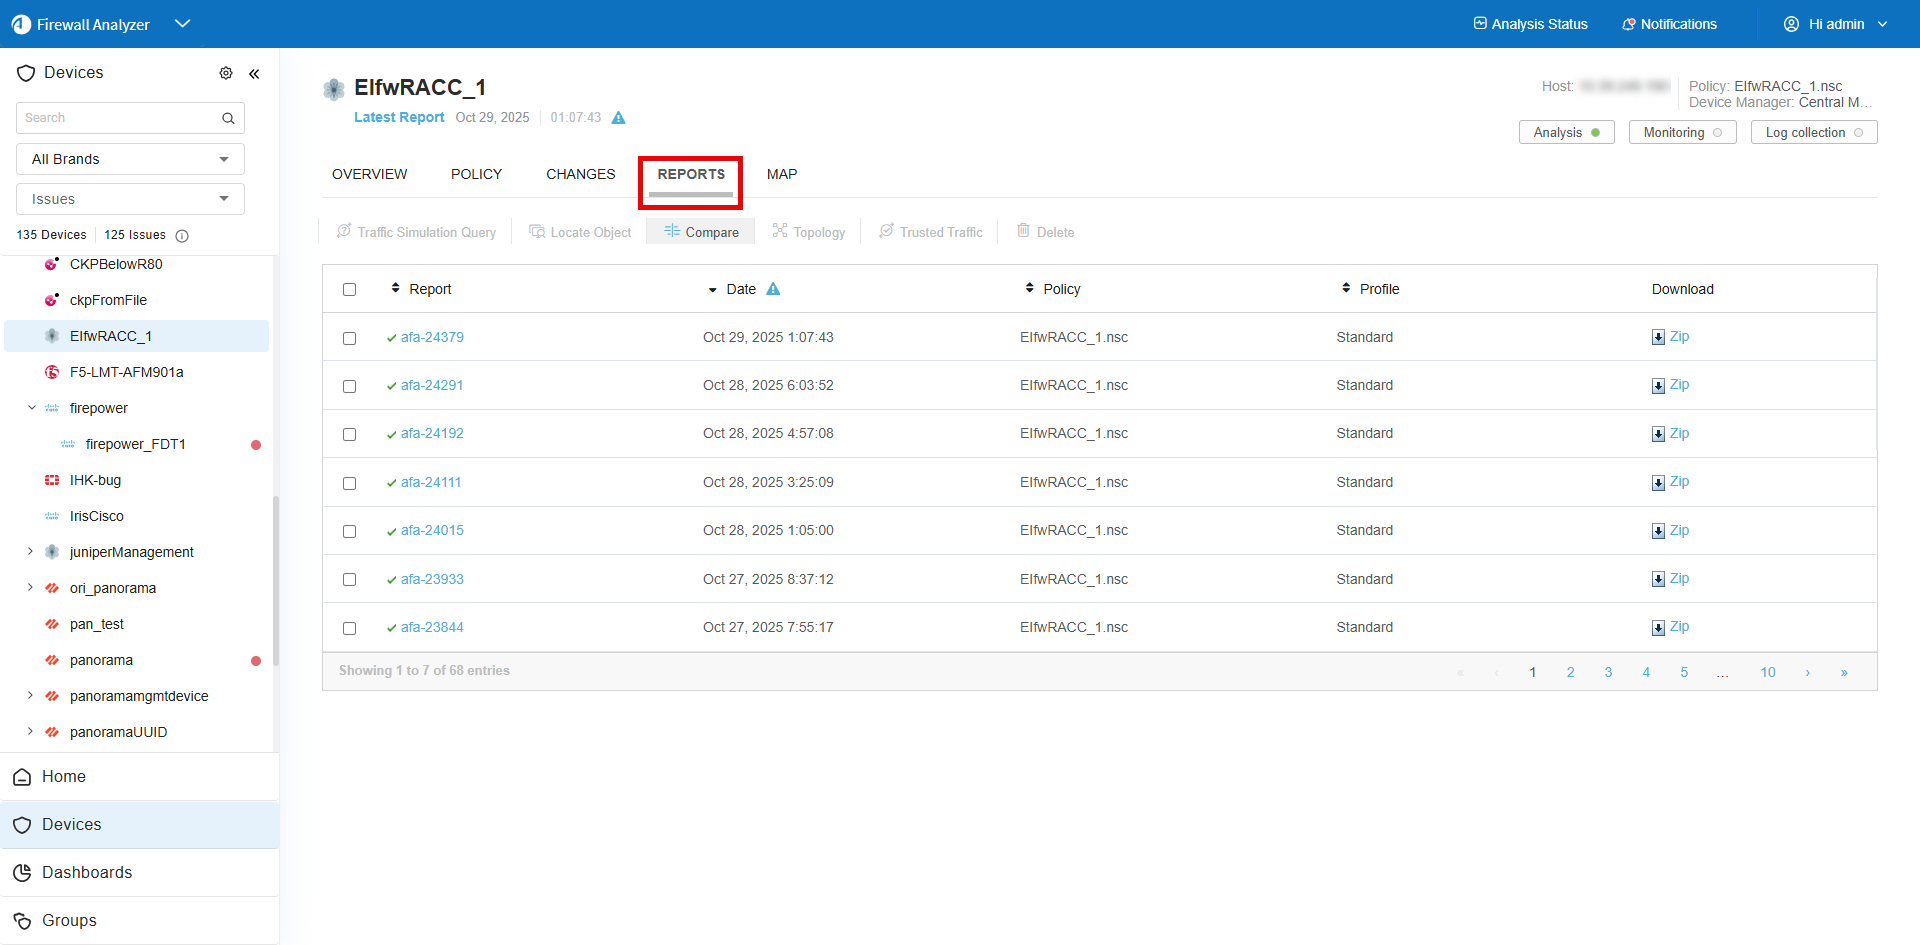
Do the following:
-
Browse to and select your device in the device tree.
-
In the workspace, click the REPORTS tab, which displays a list of all available reports for the device.
Report status is listed as follows:
-
 Report was generated successfully
 -
 Report is currently being generated
 -
 Report failed to generate
-
-
Do one of the following:
- To view a report online, click the report's name.
- To download a report to your computer, click the Zip link in the row for the report you want to download.
For more details, see AFA reports.
Do the following:
-
At the top of the device tree, click the ALL_FIREWALLS node.
-
In the workspace, click the ALL REPORTS tab, which displays a list of all available reports for all devices in the system.
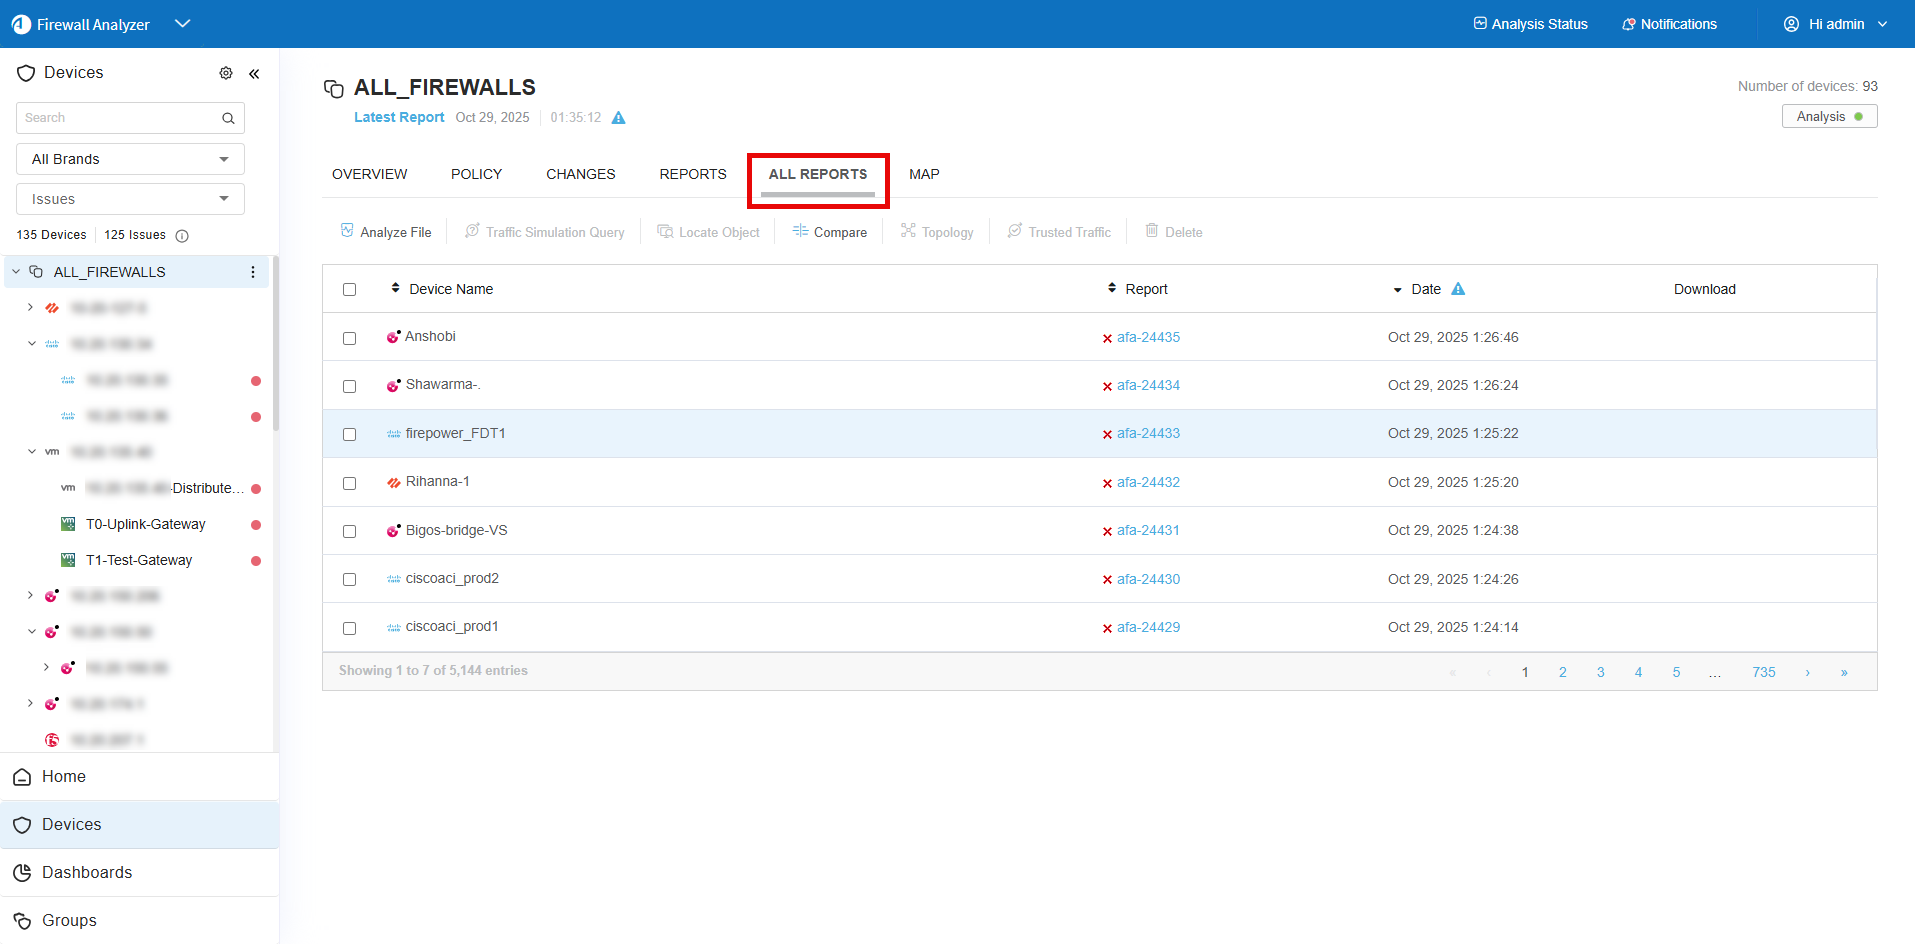
Report status is listed as follows:
-
Report was generated successfully
-
Report is currently being generated
-
Report failed to generate
-
-
Do one of the following:
- To view a report online, click the report's name.
- To download a report to your computer, click the Zip link in the row for the report you want to download.
For more details, see AFA reports.
Tip: At the top right of each page in the report, click Export / Print PDF to export the report to a shareable PDF file. For more details, see Export AFA screens to PDF.
Device report page reference
The following tables describe the pages included in device reports.
|
|
Home. Provides a general overview of the report, including basic device information and statistics, changes to the device, and device connectivity. For details, see HOME page. |

|
Risks. Provides a high-level executive summary of the risk analysis findings. Available only with the AFA Risk and Compliance Module. For details, see RISKS page. |

|
Risky Rules. Provides a list of all the risky rules (vs. the actual risk displayed in the summary page) found in the device policy, along with links to all the risks to which each rule contributed. Available only with the AFA Risk and Compliance Module. For details, see RISKY RULES page. |

|
Changes. Displays the changes in rules, objects, and the resulting changes in allowed traffic and risks, over all the history of AFA reports for this device. For details, see CHANGES page. |

|
Policy Optimization. Find out what you can eliminate from your device policy to optimize it and make it more efficient and maintainable. For details, see POLICY OPTIMIZATION page. |

|
VPN. Allows navigating through the VPN definitions on your device: identify the users, user groups, VPN rules, and VPN communities, and the relationships between these entities. For details, see VPN page. |

|
Policy. Provides access to the wealth of detailed information collected and identified during the analysis. For details, see POLICY Page. |

|
Regulatory Compliance. Access a variety of automatically-filled compliance reports. Available only with the AFA Risk and Compliance Module. For details, see REGULATORY COMPLIANCE page. |

|
Baseline Compliance. Indicates whether the device's configuration complies with a certain baseline. For details, see BASELINE COMPLIANCE page. |

â See also:
