Review account status
The AppViz OVERVIEW page enables you to more easily manage many accounts from multiple vendors. Identify the accounts to focus on and then view the relevant pages to investigate the issues.
Access the Overview page
To open the Overview page, click the  OVERVIEW icon on the left.
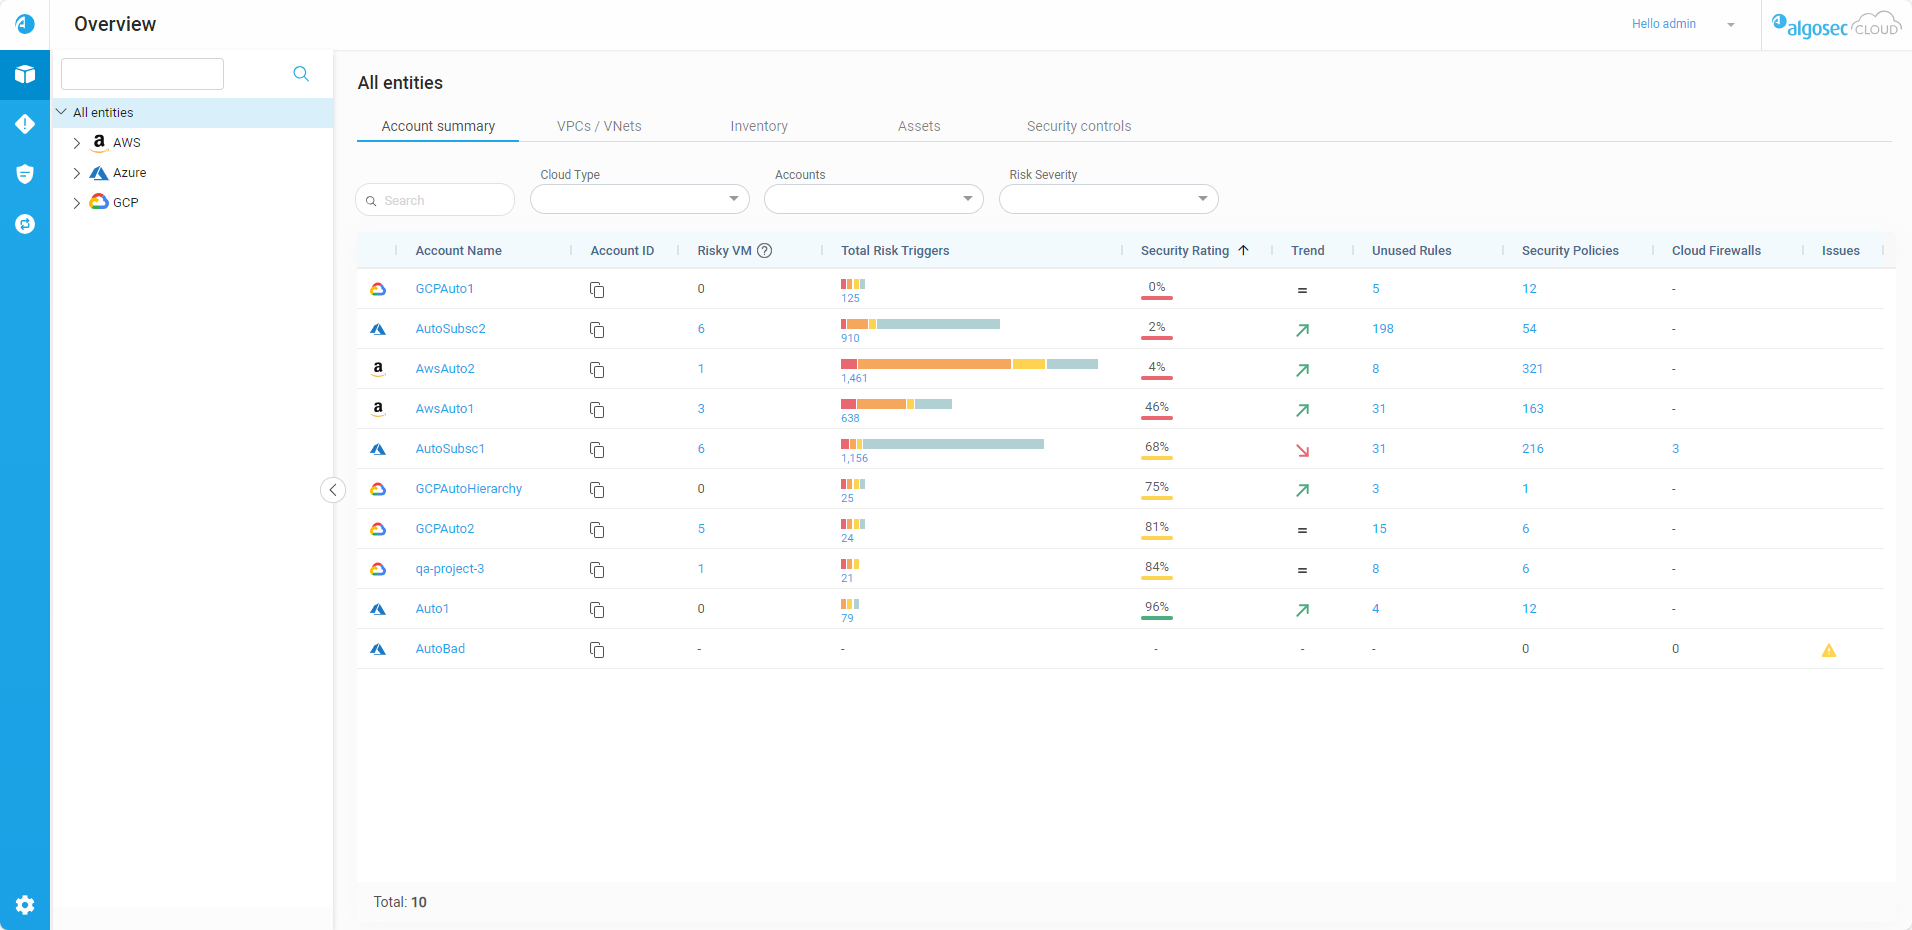
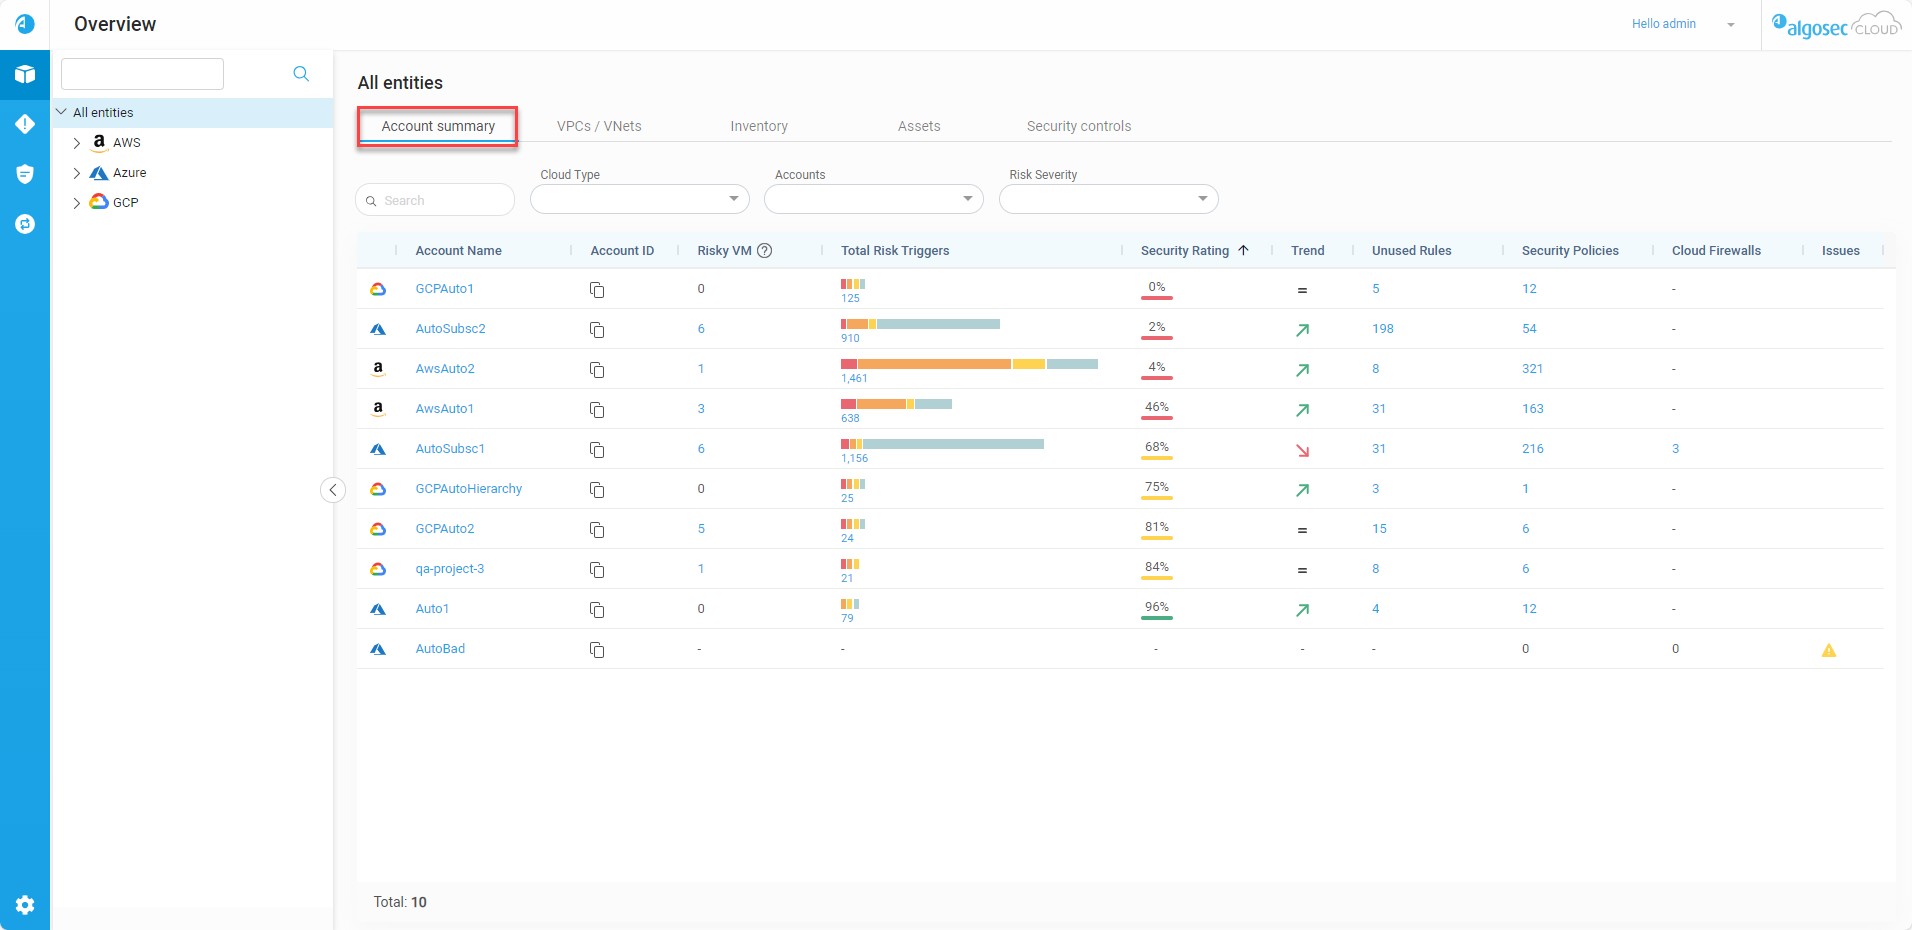
By default, the page opens on the Account summary tab and displays an overview of all accounts onboarded to AppViz. To learn more about each of the tabs, see Overview page tabs.
Overview page tabs
Use the Account summary, VPCs / VNets, Inventory, Assets, and Security controls tabs in combination with the selected entity in the Overview Tree and filter options for a targeted view of the managed accounts, the protected assets, and the security controls.
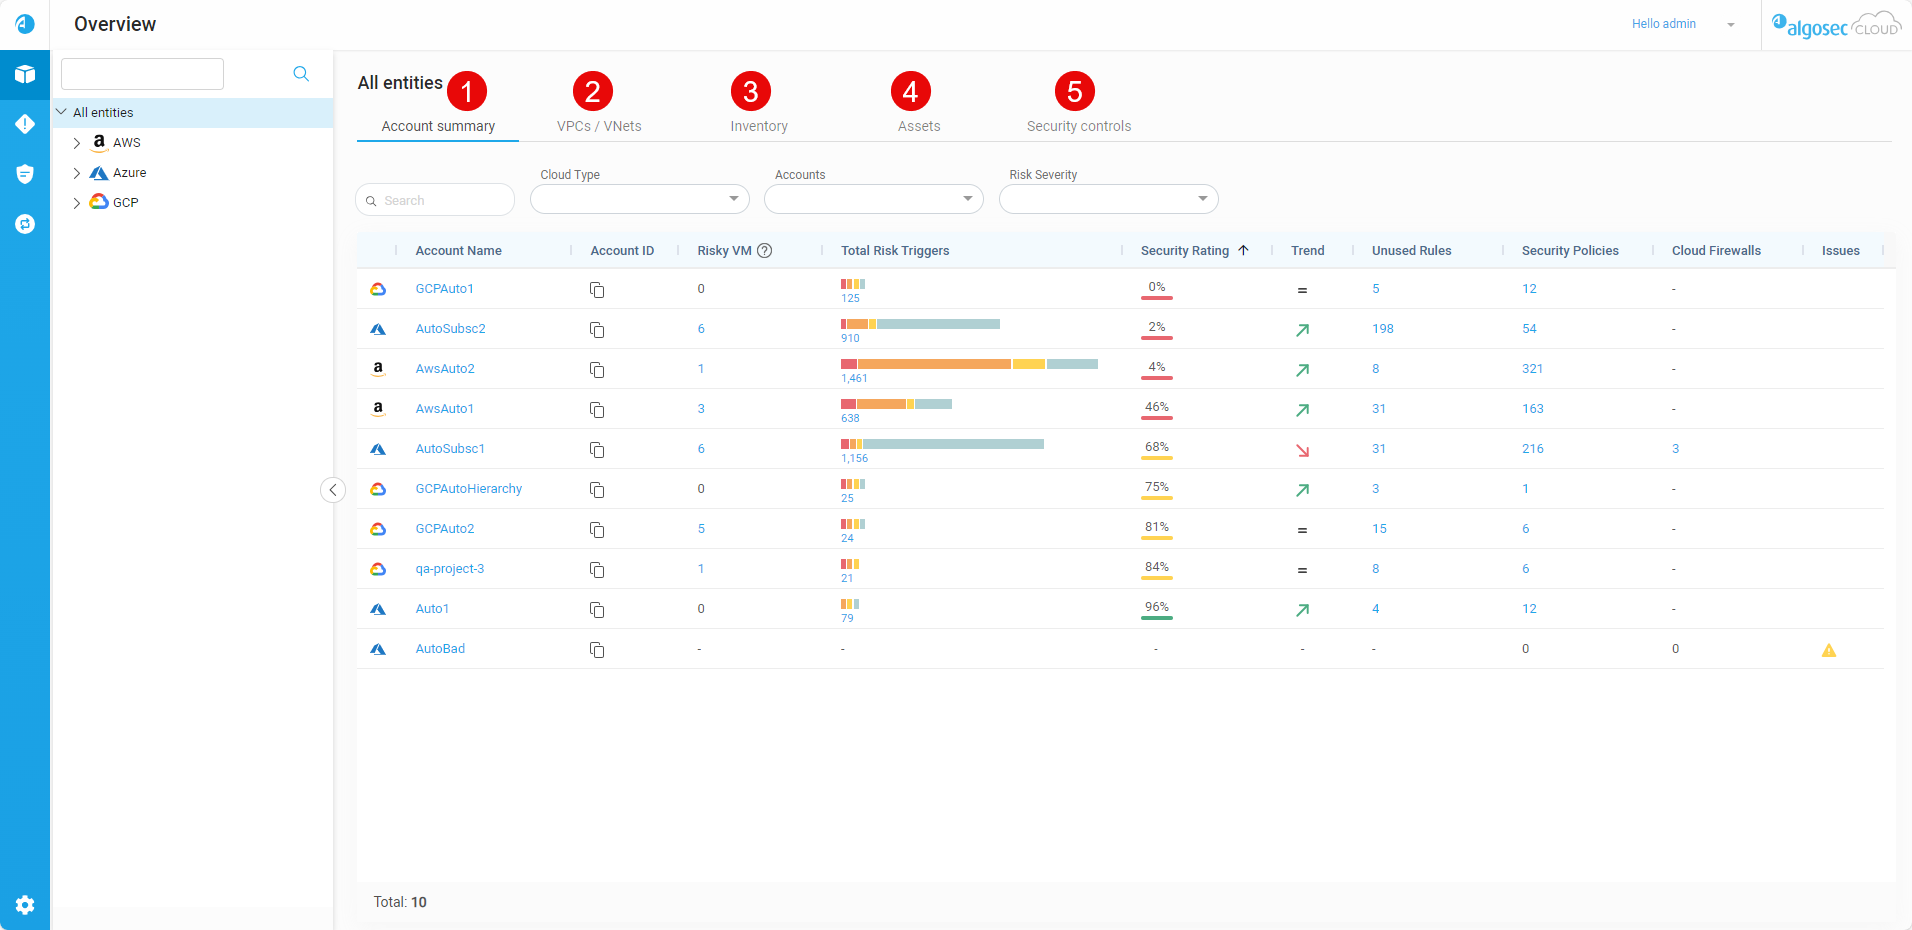
The Account Summary tab displays an aggregated view of accounts based on your selection in theOverview Tree and Account Summary tab search and filter options. See the table below for a description of the information available in the Account Summary tab.
By default, the most risky accounts are listed first. To sort by a different column, click on that column name.
| Column Name | Description |
|---|---|
|
Account Name |
Displays the vendor icon (AWS, Azure, Google Cloud) and name of the account / subscription / project. Click on an Account Name to navigate to the corresponding VPCs / VNets tab. There, you can review the virtual networks that makes this account risky. |
|
Account ID |
The Account ID is the unique ID generated by the vendor that identifies the account / subscription / project. Hover over the Tip: To copy the Account ID, hover over the |
| Risky VM |
Displays the number of assets configured with public IPs and which are associated with rules having critical or high risks based on the activated risk profile. Click on the number to open the Assets tab with a detailed view of the specific risky assets. |
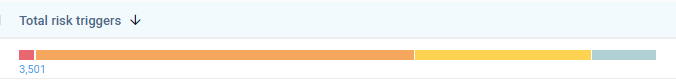
| Total Risk Triggers |
Displays the total number of risk triggers and categorizes them into a bar graph using distinct colors for each severity level:
█ = Critical █ = High █ = Medium █ = Low Tip: To view detailed information about risks categorized by their specific severity levels, click on the respective colors displayed on the bar graph. Alternatively, to access details regarding all risks, click on the total count. Click on the total number or one of the colors in the bar graph to view the corresponding risks on the Risks page. |
| Security Rating |
Indicates the network security compliance level of the account. For details on how the security rating is calculated, see Calculating the Security rating. A color-coded bar beneath the rating gives a visual indication of the level of compliance as follows: █ 0-50% █ 51-84% █ 85-100% Note: In a situation where data collection was never completed, N/A is displayed. |
| Trend |
Indicates any changes over time in the security rating of the account.
Note: The trend is determined by comparing the current security rating with the rating 30 days prior. If data is unavailable, the rating from the next most recent historical day (for example, day 29) is used. |
| Unused Rules |
Displays the number of rules with no traffic logged during the configured inactivity period. Click on the number to view details about the unused rules on the Network Policies page. For details about viewing and managing unused rules see Clean up policies. |
|
Security Policies |
Displays the number of security policies for each account (not including policies on cloud firewalls). Click on the number to view details about the policies on the Network Policies page. |
|
Cloud Firewalls |
Displays the number of Azure firewalls. Click on the number to view details about the policies on the Network Policies page. |
| Issues |
If an issue occurred while collecting account data, Possible issues include the following:
|
Account Summary tab search and filter options
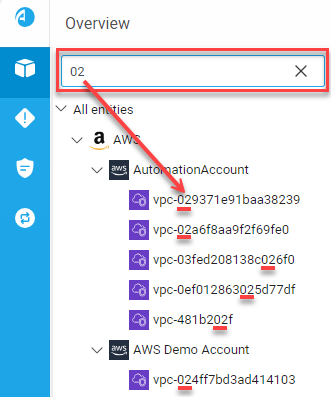
Use the search and filter fields to see a targeted selection of accounts.

| Search | Search accounts using partial or whole account names or vendor IDs. |
| Cloud Type | Filter by vendor type(s) (AWS, Azure, Google Cloud). |
| Accounts | Filter by account name(s). |
| Risk Severity | Filter by risk severity (Critical, High, Medium, Low). |
The VPCs / VNets tab displays an aggregated view of VPCs and VNets based on your selection in the Overview Tree and VPCs / VNets tab search and filter options. See the table below for a description of the information available in the VPCs / VNets tab.
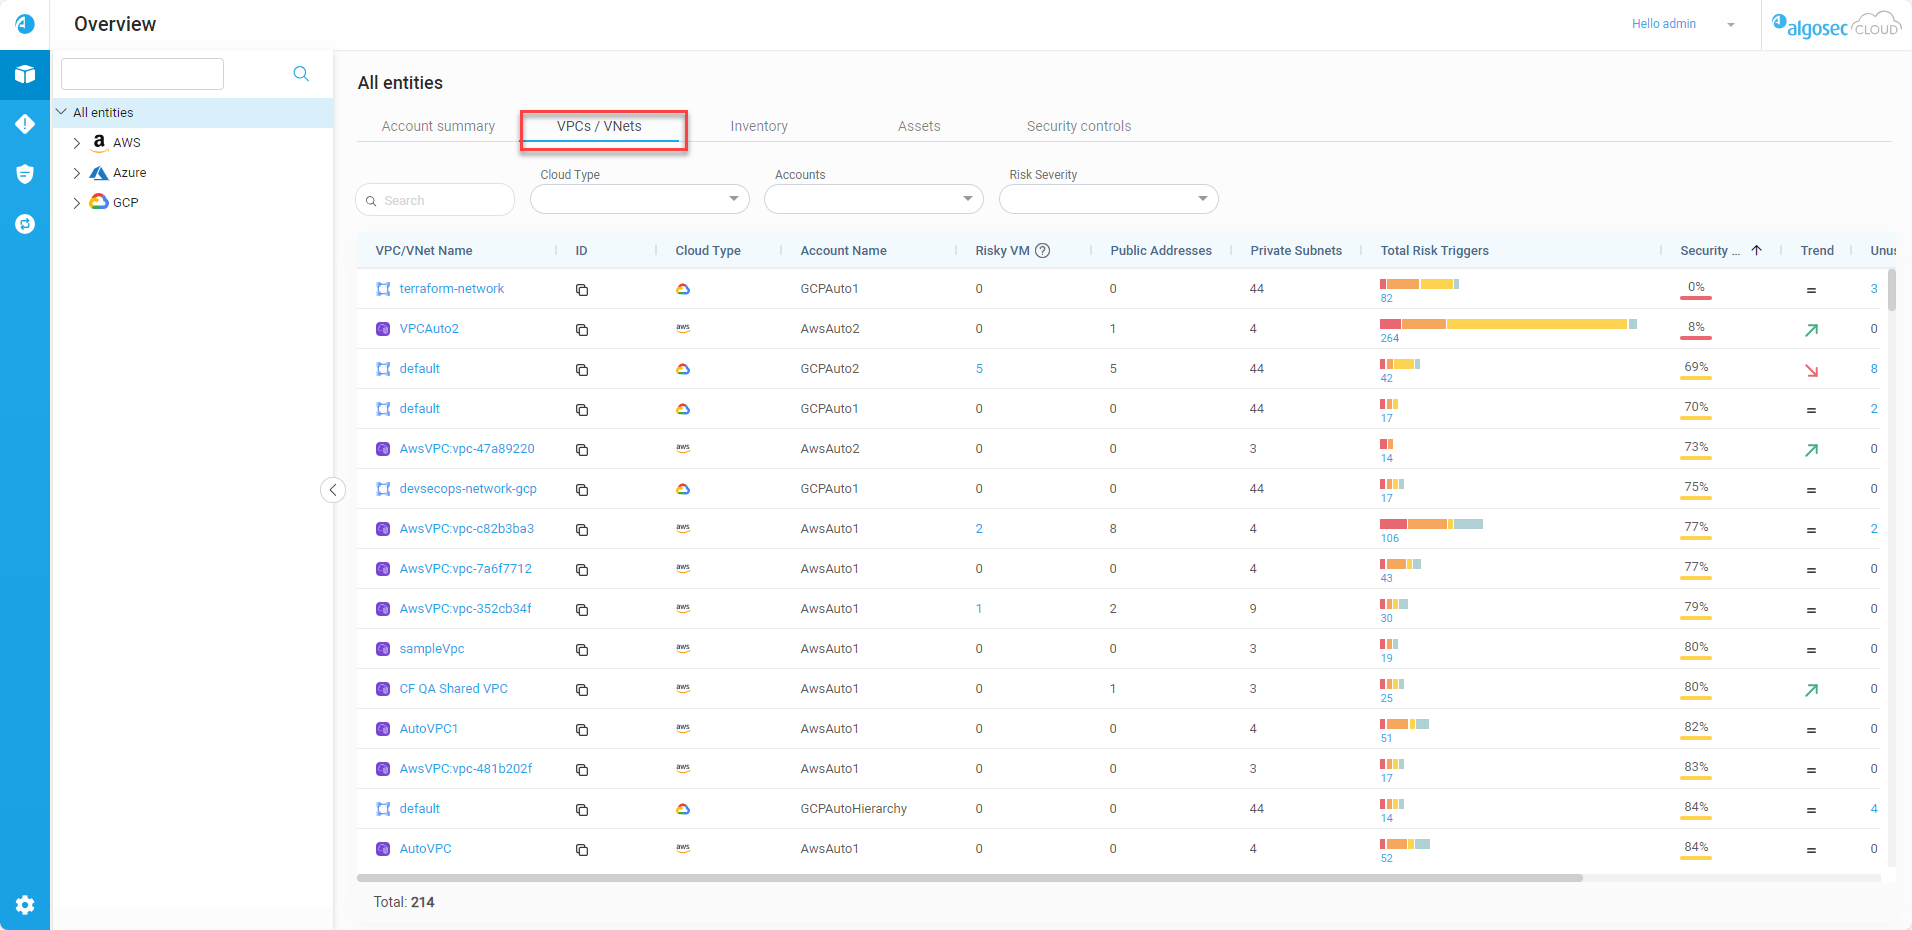
By default, the most risky VNets / VPCs are listed first. To sort by a different column, click on that column name.
| Column Name | Description |
|---|---|
| VPC / VNet Name |
Displays the VPC / VNet icon and name. |
|
ID |
The ID is the unique ID generated by the vendor that identifies the VPC / VNet. Hover over the Tip: To copy the ID, hover over the |
| Cloud Type | Displays the icon of the vendor. |
| Account Name | The name of the account where this virtual machine is located. |
| Risky VM |
Displays the number of virtual machines configured with public IPs and which are associated with rules having critical or high risks based on the activated risk profile. Click on the number to open the Assets tab with a detailed view of the specific risky virtual machines. |
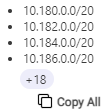
| Public Addresses |
Displays the total number of public IPs associated with all interfaces in the virtual network. Hover over the number to display a tooltip with a list of the IPs.
Tip: To copy the full list of public IP addresses to the clipboard, click Note: The tooltip displays up to 25 IP addresses. If there are more, a chip shows the number of additional IP addresses. |
| Private Subnets |
Displays the total number of private subnets associated with all interfaces in the virtual network. Hover over the number to display a tooltip with a list of the subnets. AWS and Azure display additional network information, with AWS showing CIDRs and Azure showing Address Spaces. Tip: To copy the full list of private subnets to the clipboard, click Note: The tooltip displays up to 25 private subnets. If there are more, a chip shows the number of additional private subnets. |
| Total Risk Triggers |
Displays the total number of risk triggers and categorizes them into a bar graph using distinct colors for each severity level:
█ = Critical █ = High █ = Medium █ = Low Tip: To view detailed information about risks categorized by their specific severity levels, click on the respective colors displayed on the bar graph. Alternatively, to access details regarding all risks, click on the total count. Click on the total number or one of the colors in the bar graph to view the corresponding risks on the Risks page. |
| Security Rating |
Indicates the network security compliance level of the virtual machine. For details on how the security rating is calculated, see Calculating the Security rating. A color-coded bar beneath the rating gives a visual indication of the level of compliance as follows: █ 0-50% █ 51-84% █ 85-100% Note: In a situation where data collection was never completed, N/A is displayed. |
| Trend |
Indicates any changes over time in the security rating of the virtual machine.
Note: The trend is determined by comparing the current security rating with the rating 30 days prior. If data is unavailable, the rating from the next most recent historical day (for example, day 29) is used. |
| Unused Rules |
Displays the number of rules with no traffic logged during the configured inactivity period. Click on the number to view details about the unused rules on the Network Policies page. For details about viewing and managing unused rules see Clean up policies. |
|
Security Policies |
Displays the number of security policies for each virtual machine (not including policies on cloud firewalls). Click on the number to view details about the policies on the Network Policies page. |
|
Cloud Firewalls |
Displays the number of Azure firewalls. Click on the number to view details about the policies on theNetwork Policies page. |
| Issues |
If an issue occurred while collecting account data, Possible issues include the following:
|
VPCs / VNets tab search and filter options
Use the search and filter fields to see a targeted selection of virtual machines.
| Search | Search virtual machines using partial or whole account names or vendor IDs. |
| Cloud Type | Filter by vendor type(s) (AWS, Azure, Google Cloud). |
| Accounts | Filter by account name(s). |
| Risk Severity | Filter by risk severity (Critical, High, Medium, Low). |
The Inventory tab displays an overview of the selected Assets and Security Controls.
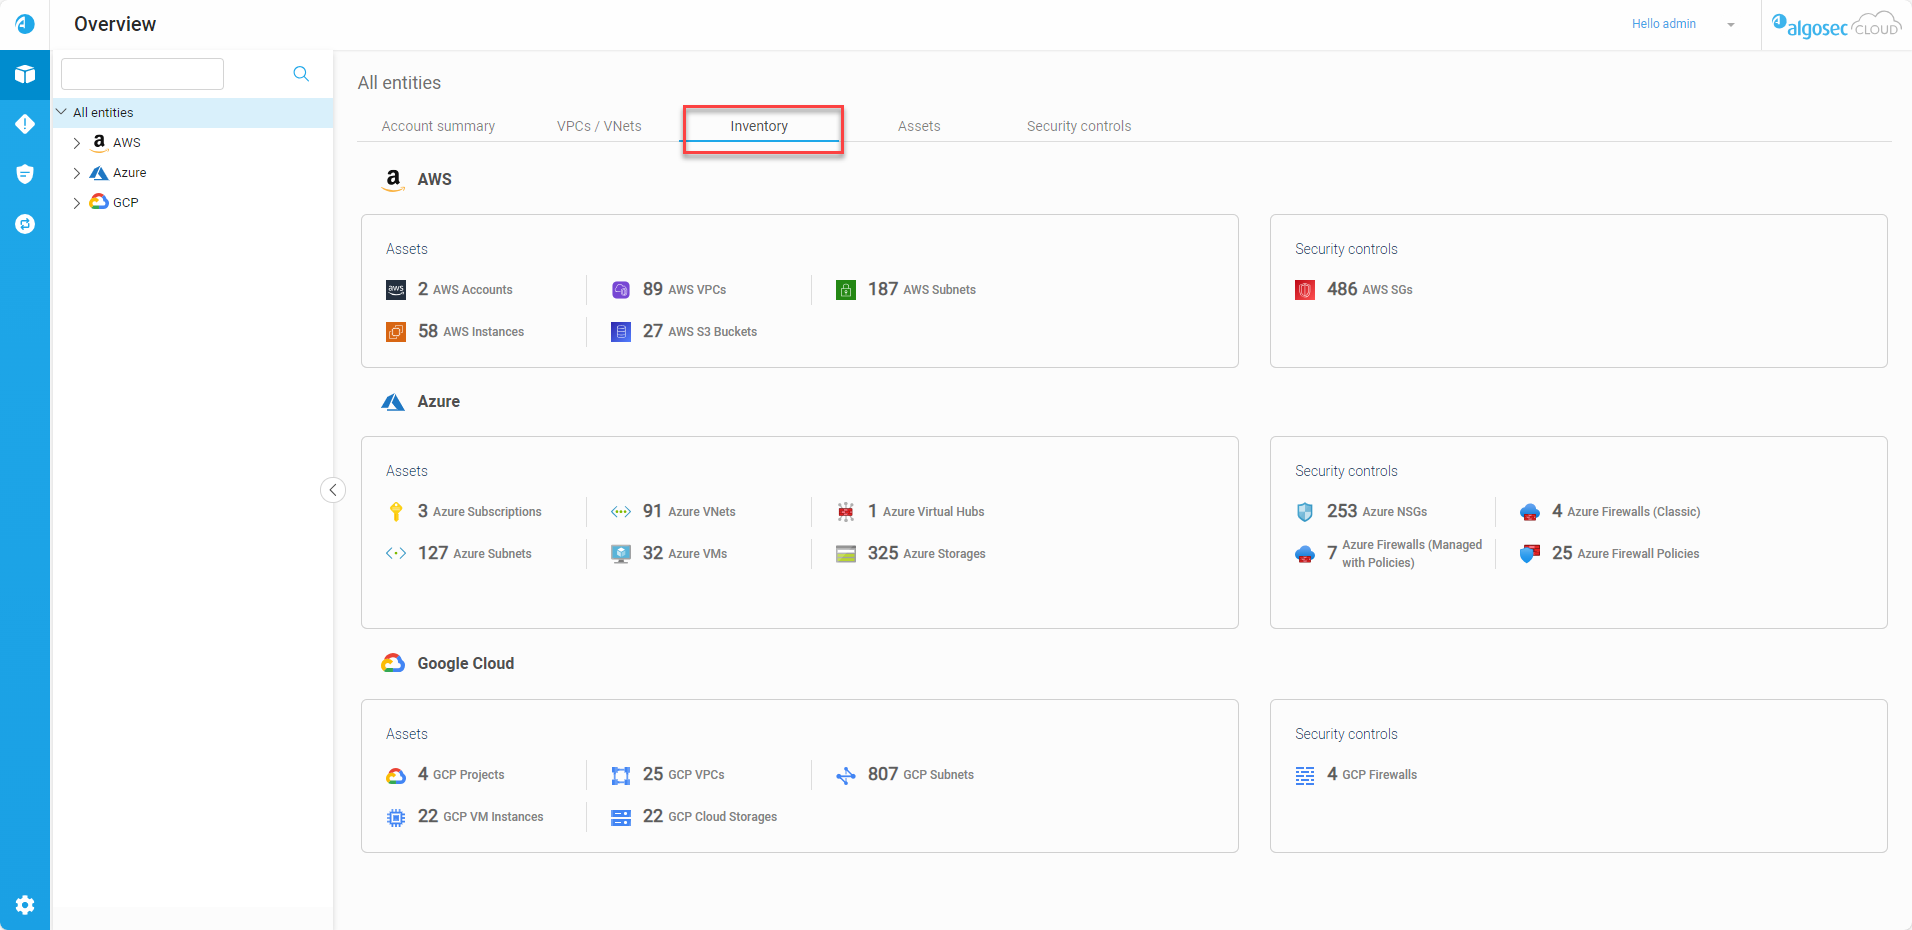
Inventory resource types
Your AppViz inventory is organized into the following resource types:
|
Assets |
AWS
Azure
Google Cloud
|
|
Security controls |
Includes the following types of security controls:
|
Note: The assets displayed in the Inventory tab is a partial selection highlighting the most important assets. For a comprehensive list of all assets, along with detailed information about each, please refer to the Assets tab.
The Assets tab displays an aggregated view of assets based on your selection in the Overview Tree and Assets tab Search and Filter options. See the table below for a description of the information available in the Assets tab.
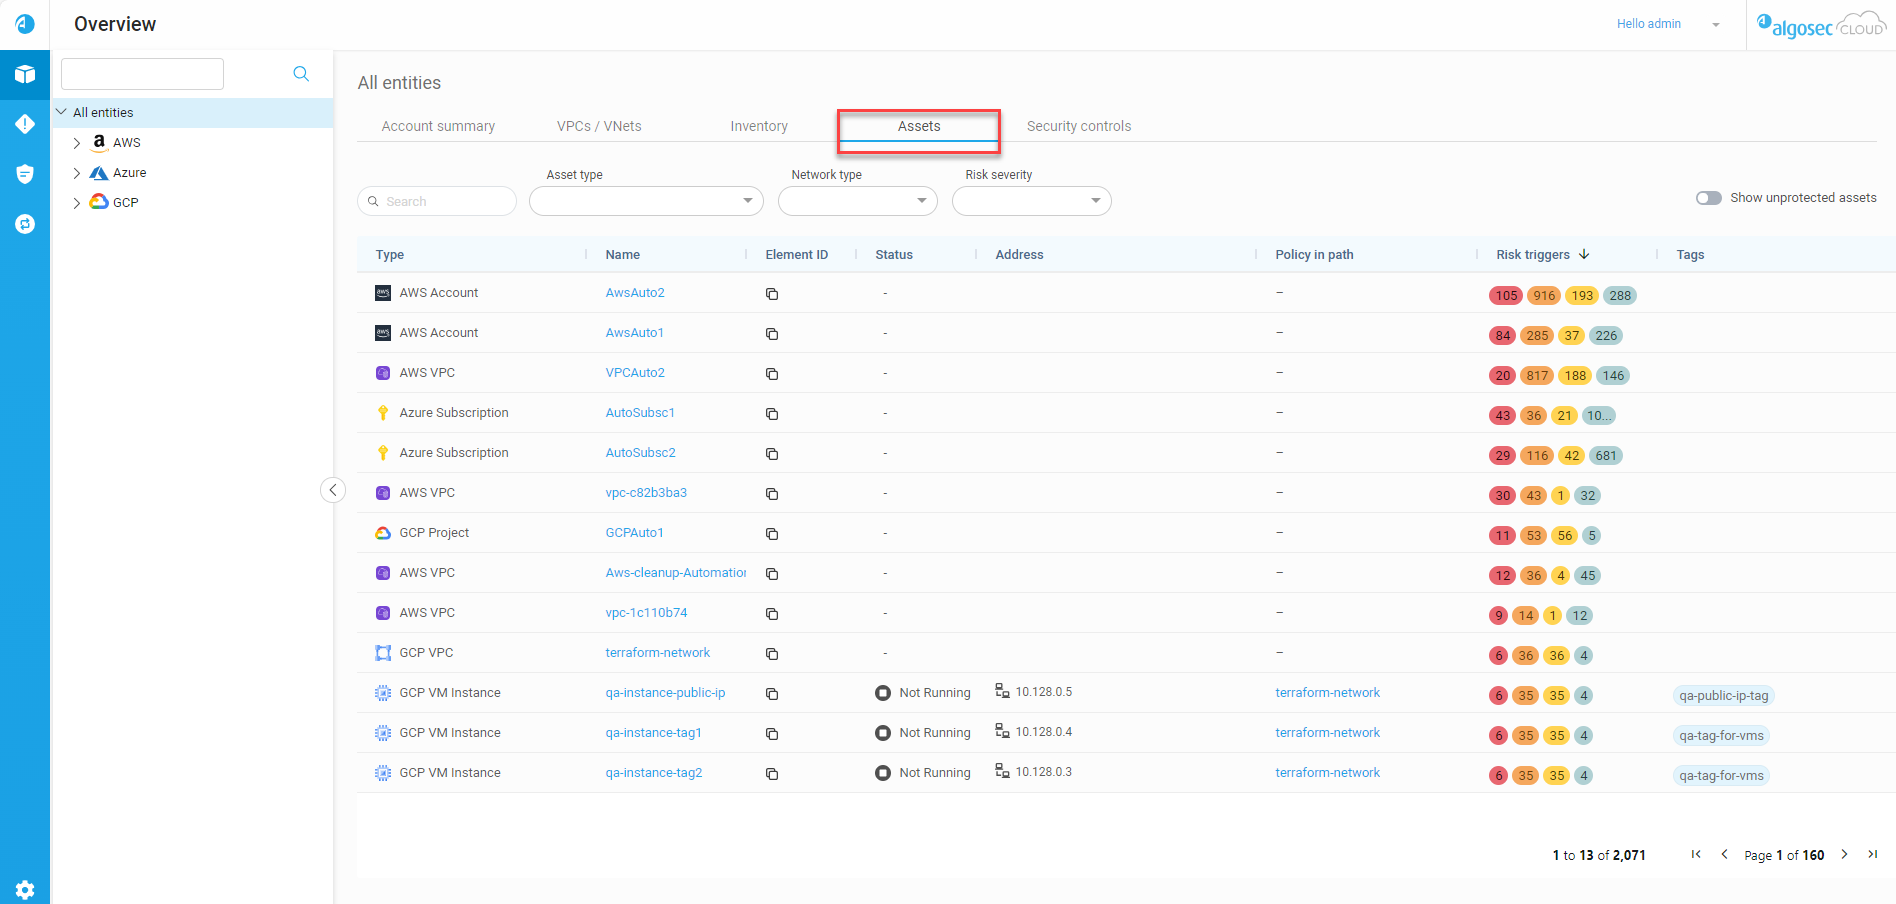
| Type | Type of cloud asset (for example, VM, firewall, subnet). |
|
Name |
User-defined name of the onboarded asset. Click an asset name to view element details. See View Element Details. Note: For virtual machines, click to view all associated risk triggers. For more details, see View risk triggers associated with a virtual machine. |
|
Element ID |
The Element ID is the unique ID generated by the vendor that identifies the element. Hover over the Tip: To copy the Element ID, hover over the |
|
Status* |
Displays the state of the machine:
|
|
Address* |
The When the asset has multiple IP addresses hover over the number to see the additional IP addresses. Note for Azure: AppViz displays the following:
|
|
Policy in path* |
Displays one of the following:
|
| Risk triggers |
The number of risk triggers detected at each severity level associated with this asset. |
| Tags | Any key/value definitions assigned to the asset. |
View risk triggers associated with a virtual machine
From the Assets tab, click a virtual machine name to see a list of all its associated risk triggers as well as details about the asset itself.
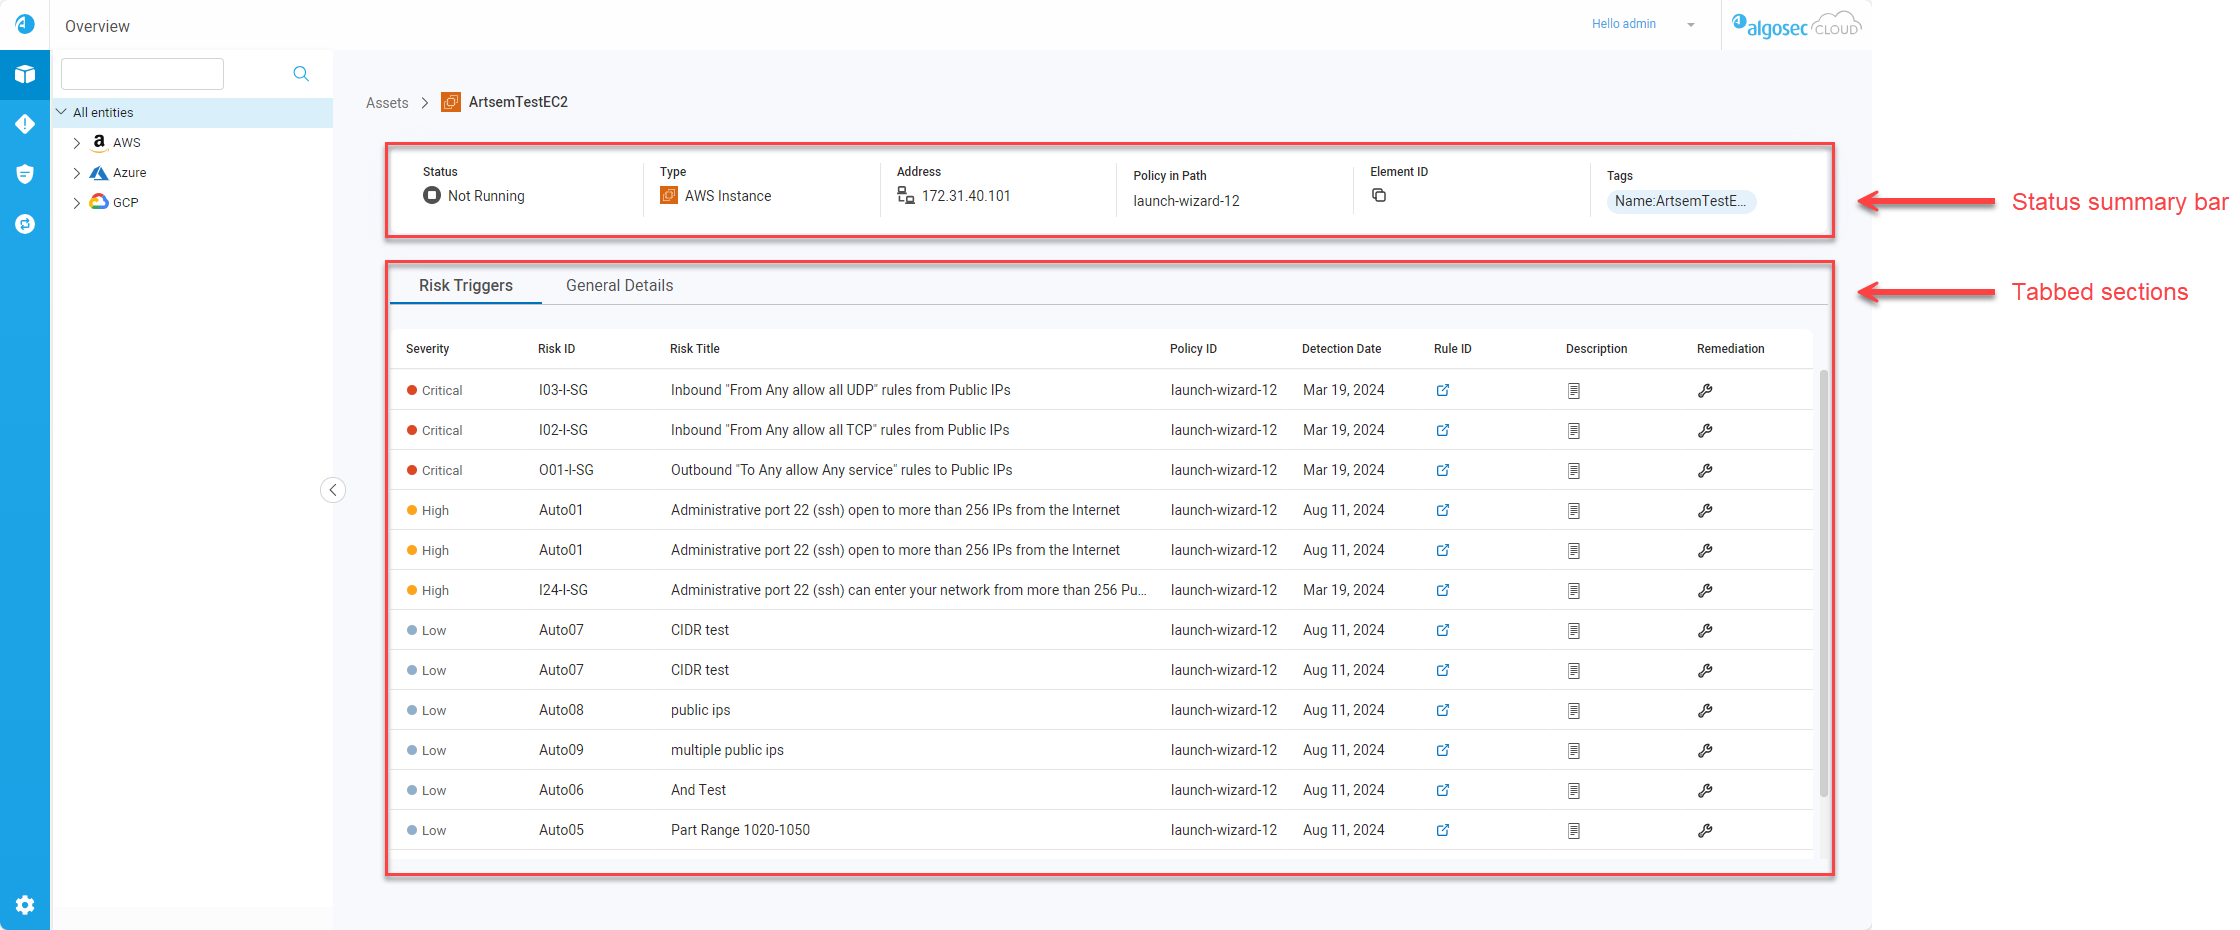
View the following information:
| Section | Description |
|---|---|
| Status summary bar | Details about the selected virtual machine. |
| Risk Triggers tab |
A list of all detected risk triggers associated with the virtual machine. The tab provides the following information:
Note: The table displays a maximum of 2000 risk triggers. |
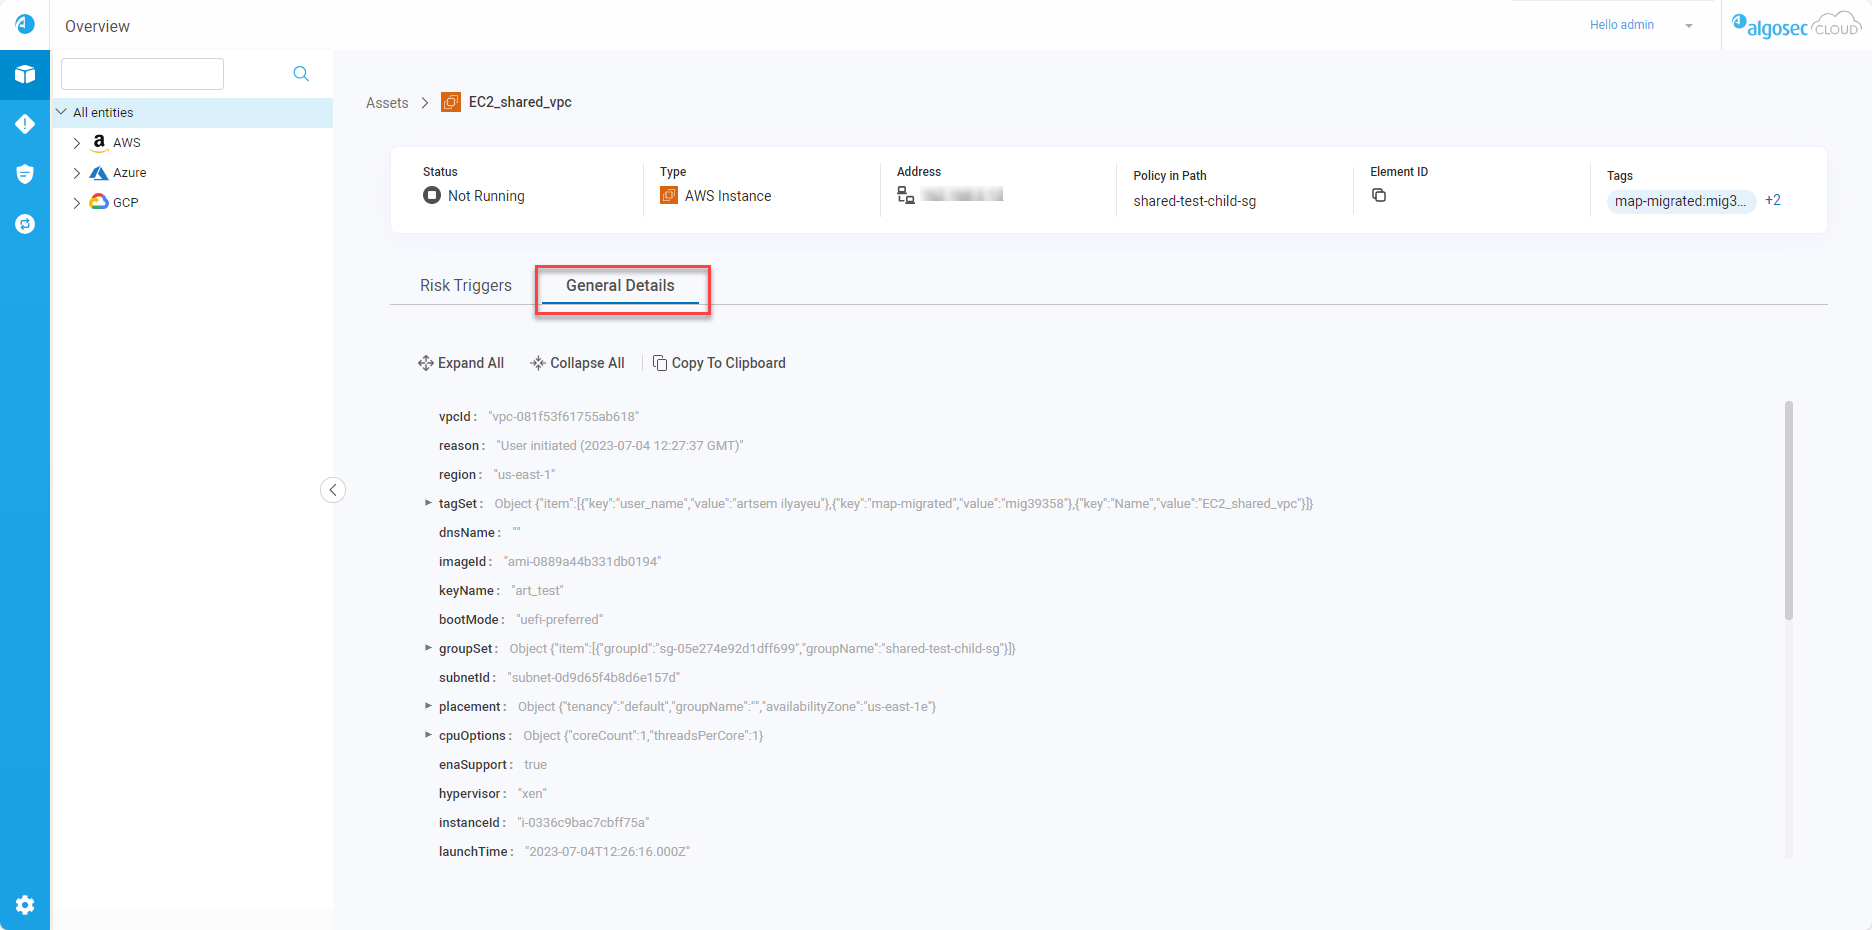
| General Details tab | View salient details about the selected virtual machine. For more details see View Element Details. |
Assets tab Search and Filter options
Use the search and filter fields to see a targeted selection of assets.

| Search | Search accounts using partial or whole asset or policy set names. |
| Asset Type | Filter by asset type(s). |
| Network Type | Filter assets by its network type (public IP, private IP). |
| Risk Severity | Filter by risk severity associated with the asset (Critical, High, Medium, Low). |
| Show unprotected assets |
Toggle to determine whether to display all assets or only VMs with no protecting policy.
|
The Security controls tab displays a detailed, complete list of the relevant security controls.
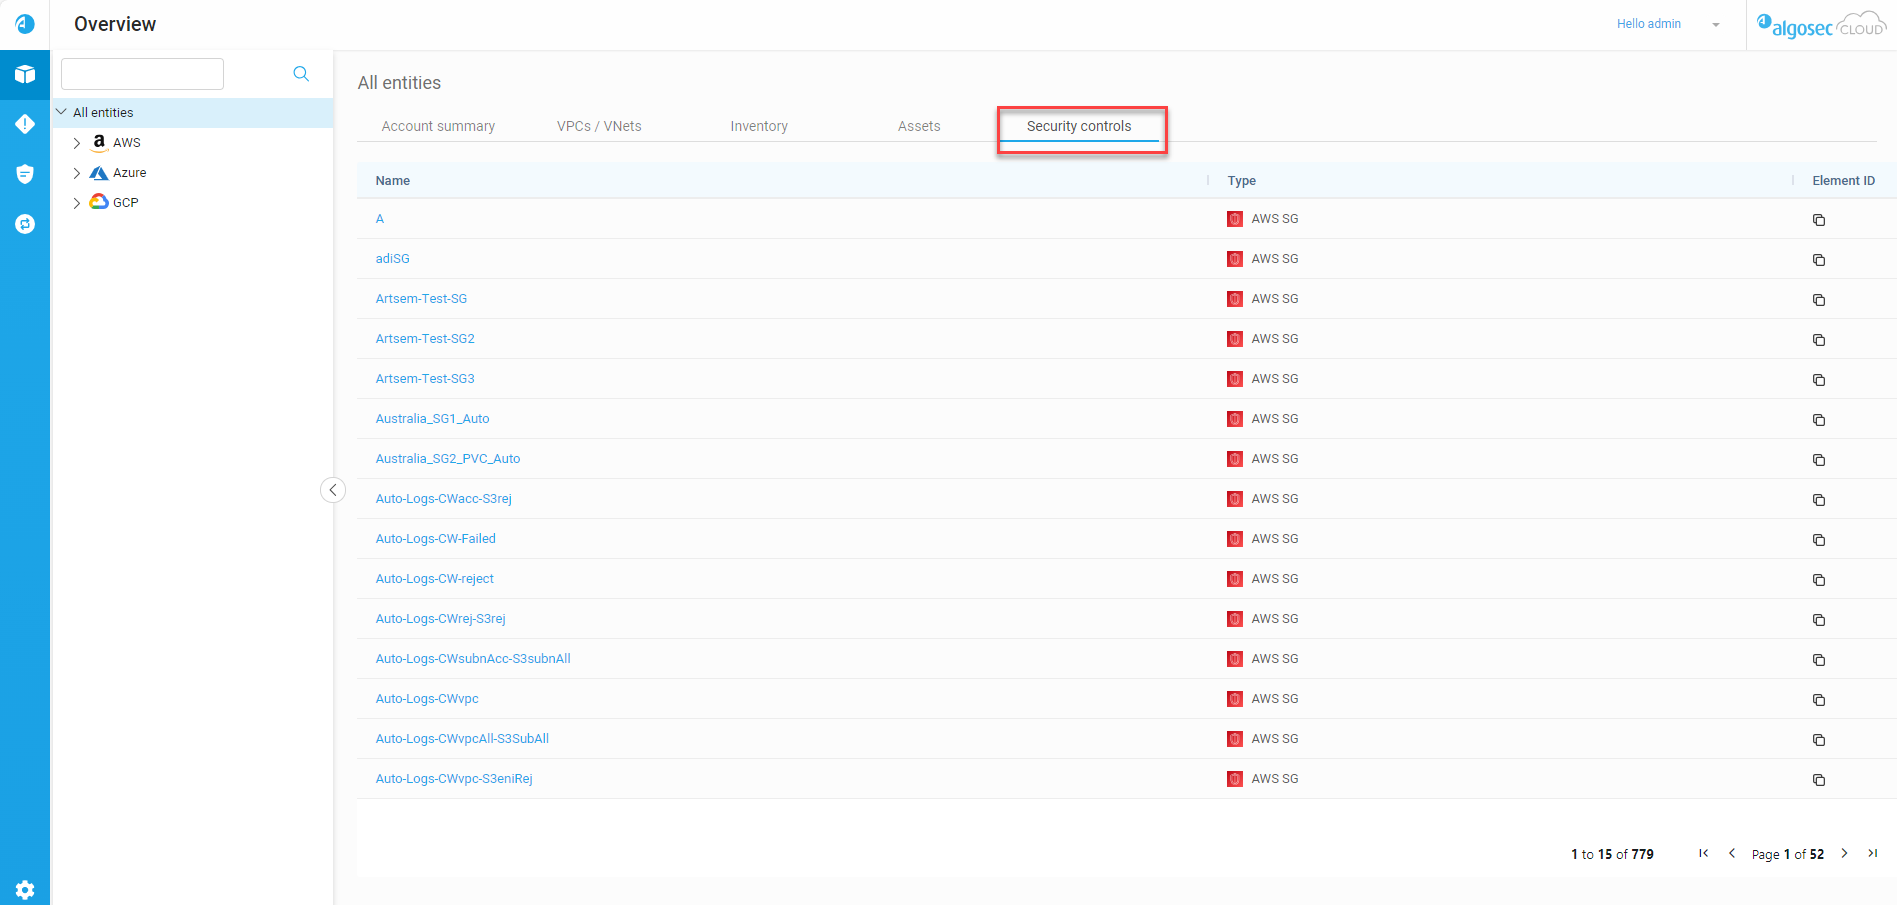
-
Click the name of the security control to view element details. See View Element Details.
View Element Details
In the Assets and Security Controls tabs, you can click on the name of the asset or security control to display the Element Details window.
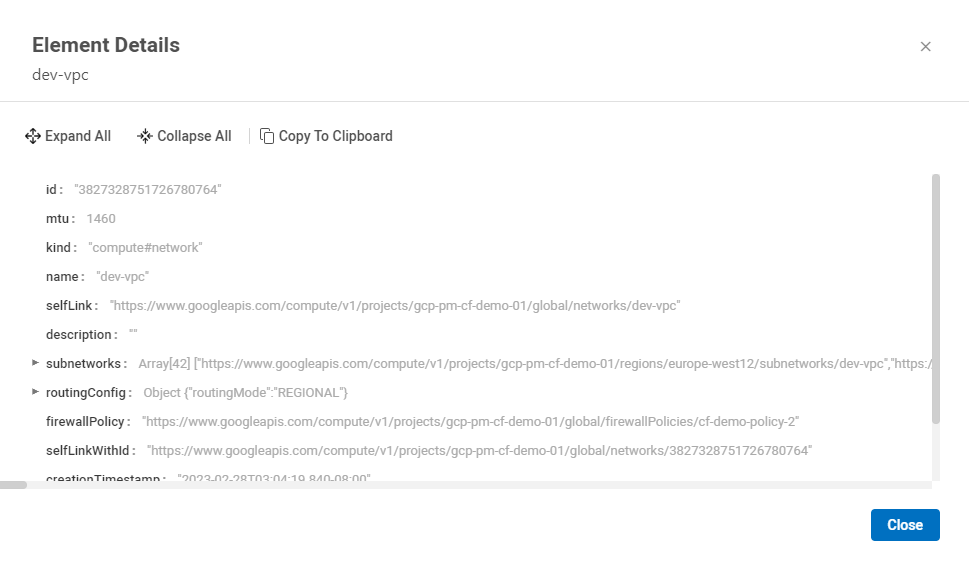
Note: To see element details for virtual machines:
-
From the Assets tab click on the name of the asset.
-
Navigate to the General Details tab.
For more details, see View risk triggers associated with a virtual machine.
Overview Tree
The Overview Tree lets you drill down to see specific assets of each vendor.
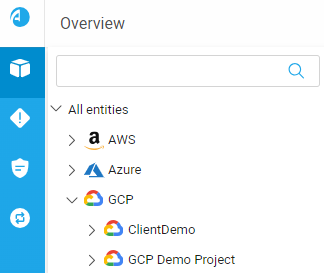
The Overview Tree contains the following entities:
| Vendor / Policy Type | Account / Subscription / Project | Virtual Network Type | ||
| Icon | Type | Icon | Type | |
| AWS |

|
Account |

|
VPC |
| Azure |

|
Subscription |

|
VNet |

|
Virtual Hub | |||
| Google Cloud |

|
Project |
|
VPC |
â See also:
