Flow Logs Analysis (AWS)
Note: For steps to configure AWS VPC Flow Logs for ACE Cloud App Analyzer, see Permission Diagnostics for the Flow Logs .
Flow Log Analysis is a capability within Application Discovery that reveals the real network behavior of your cloud applications. By analyzing AWS VPC flow logs, ACE visualizes how workloads communicate, detects unexpected external traffic, and helps you understand the operational context of your microservices.
Flow logs function like an X-ray: they don’t interpret or score the traffic. They simply show what is happening. Whether traffic is legitimate, unintended, or potentially malicious, Flow Log Analysis provides transparency so engineers can validate expected behavior, uncover anomalies, and make informed architectural and security decisions.
Working With Flow Log Analysis
Your cloud environment constantly generates traffic: microservices calling one another, workloads accessing databases, and users interacting with public-facing services. Much of this is normal, but flow logs often uncover unexpected patterns, such as:
-
External IP addresses reaching workloads that were not intended to be exposed
-
Microservices communicating in undocumented or surprising ways
-
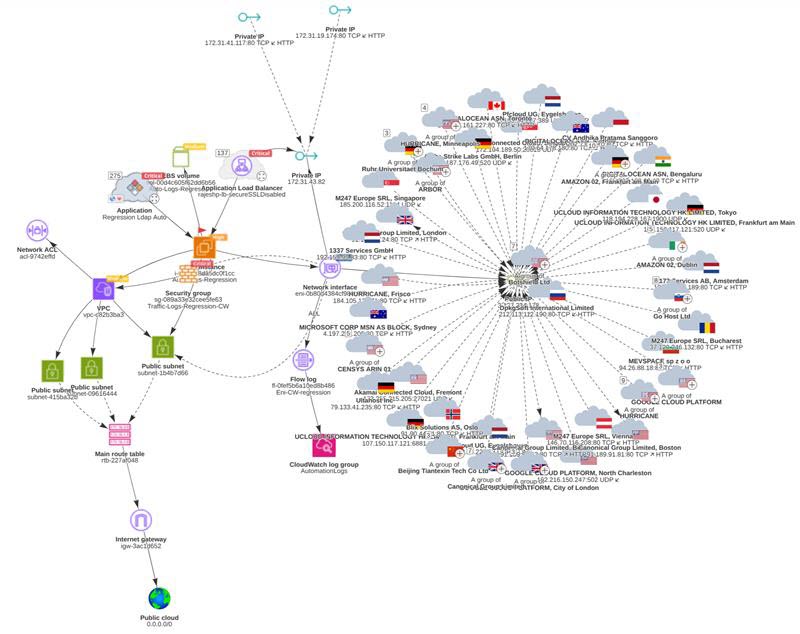
Large volumes of inbound global traffic caused by an overly open security group
-
Potential attacker behavior (for example, data exfiltration), which appears in flow logs even when no alerting exists
Flow Log Analysis helps you detect these behaviors and understand their impact on your applications.
All traffic-derived connections appear as dotted lines in the graph below.
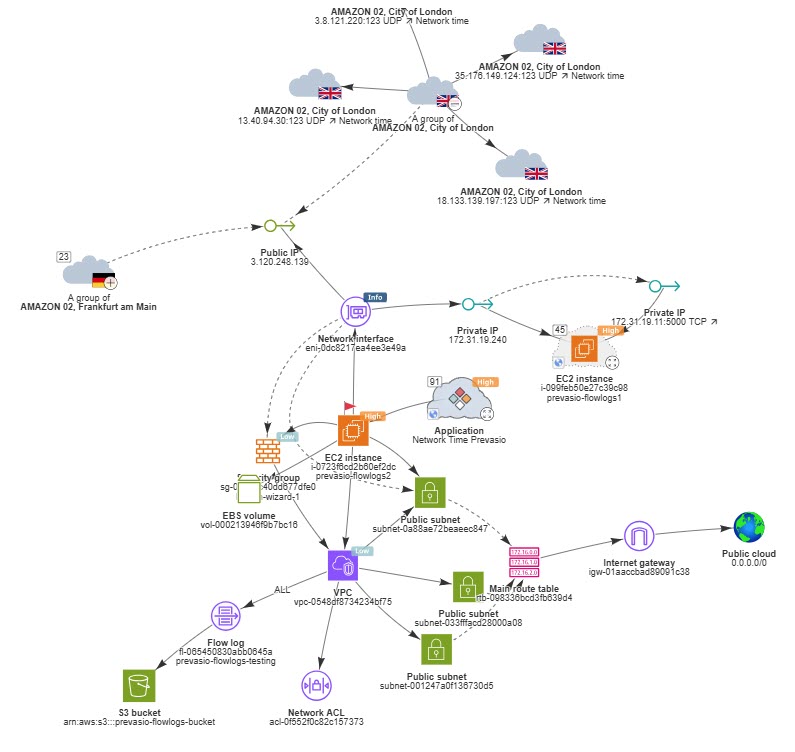
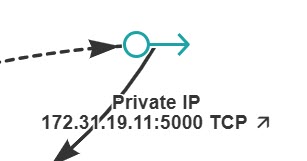
Flow logs also expose port and protocol information, allowing deeper insight into the type of service or interaction taking place.
Visibility Over Time
Flow Log Analysis uses a sliding 7-day window of flow logs. That means:
-
You see all traffic observed within the last seven days
-
Suspicious or unexpected activity within that timeframe is visible
-
Activity older than seven days naturally rolls out of view
Engineers should review Flow Log Analysis regularly to stay aware of evolving traffic patterns and exposure levels.
Types of Insight Provided by Flow Log Analysis
Identifying True Microservice Relationships
Flow logs reveal which microservices actually communicate at runtime, allowing ACE to unify them into a single application, even when that relationship isn’t apparent from configuration alone.
This provides essential context:
-
You see the real application topology, not isolated components
-
If a microservice is highly vulnerable, you can understand its impact on the entire application
-
Remediation can be prioritized based on application importance rather than individual resources
Visualizing External Exposure and Anomalies
Flow logs also show where connections originate - internal or external - and whether that behavior aligns with your design intent. ACE visualizes these patterns in the Application Discovery graph.
ACE highlights:
-
Public IPs communicating with your workloads
-
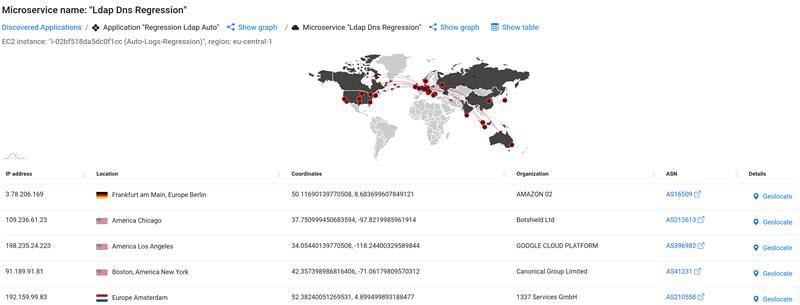
The geographic source of external traffic
-
Traffic volume and frequency
-
Signs of unintended exposure, such as activity caused by an overly open security group
Examples:
-
A public-facing web service receiving global traffic is expected
-
A private internal workload receiving traffic from unexpected regions (e.g., Brazil or China) is an anomaly worth investigating
ACE does not decide whether traffic is “good” or “bad.” It simply reveals what is happening so engineers can determine whether the behavior aligns with expectations.
This makes Flow Log Analysis a powerful tool for uncovering unintended exposure and validating security policies.
