ObjectFlow dashboard
This topic describes the ObjectFlow dashboard, which provides a summarized view of your network and service objects.
View the Dashboard
When you log in to ObjectFlow, the Dashboard is the first screen displayed.
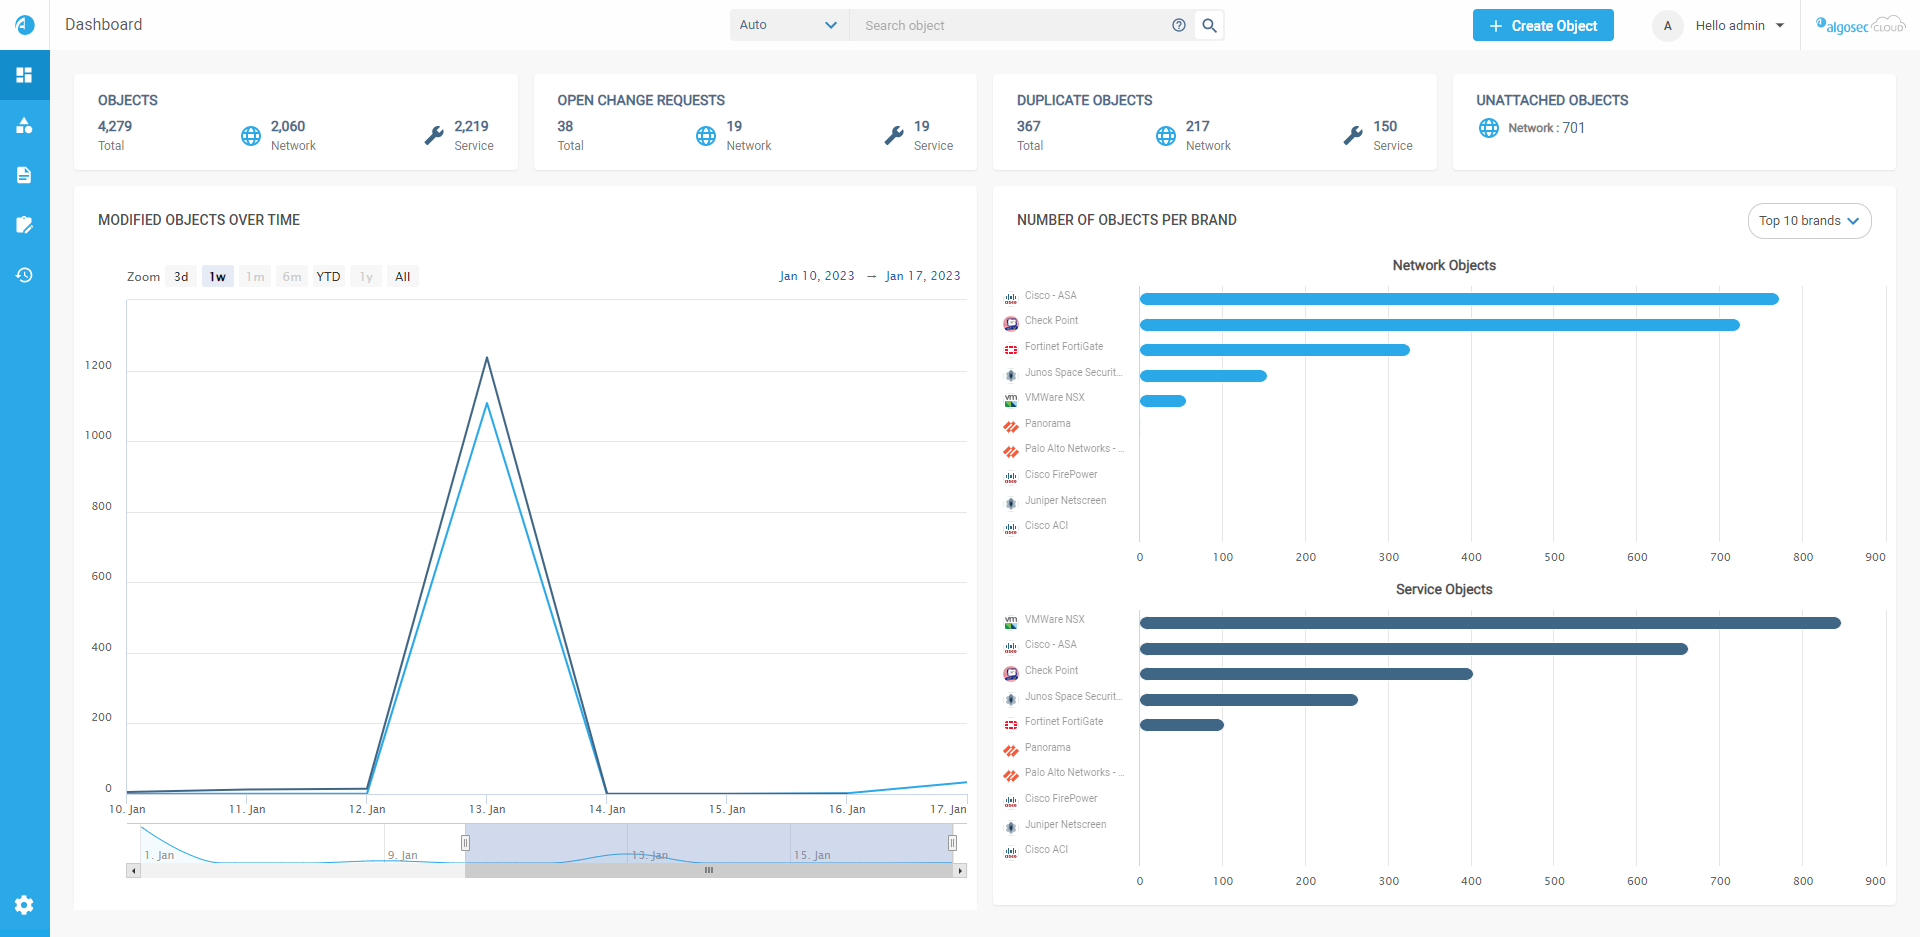
To return to the dashboard at any time, from the ObjectFlow main menu click DASHBOARD.

Two graphs are displayed:
-
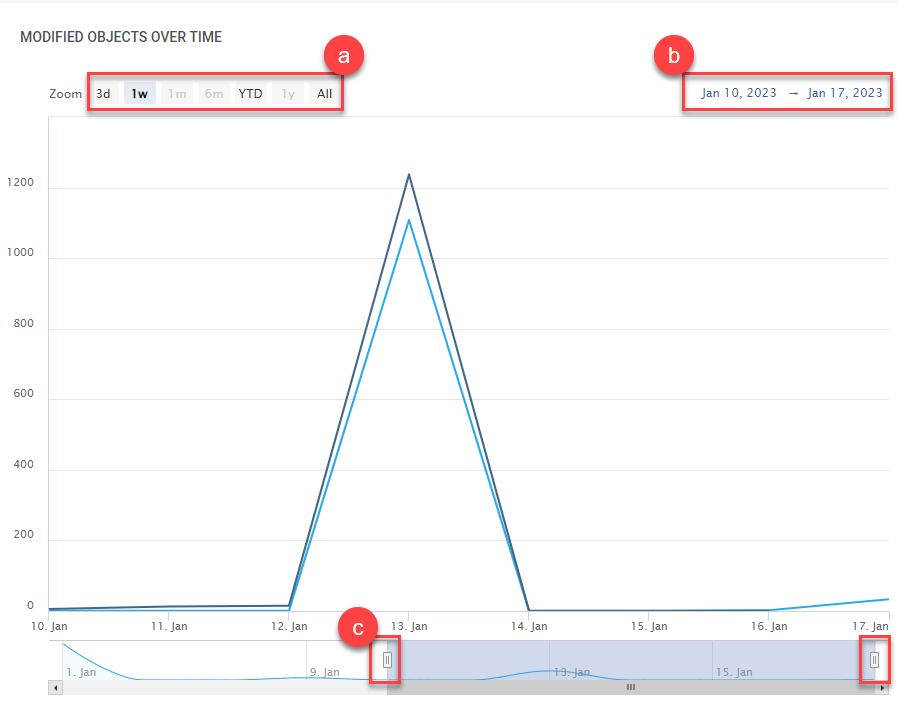
Modified Objects over Time:
Provides a high level view of object modification in your system over time:-
To change the time frame:
-
Use the Zoom menu to focus on time ranges relative to the current date, for example:
3d Last three days 1w 7 days including the current date 1m From the same date last month until today 6m Last 6 months YTD Year to date 1y In the past year All All objects modified since ObjectFlow was installed, -
Click on the start date and end date above the graph.
-
Drag the dynamic date selectors below the graph.
-
-
-
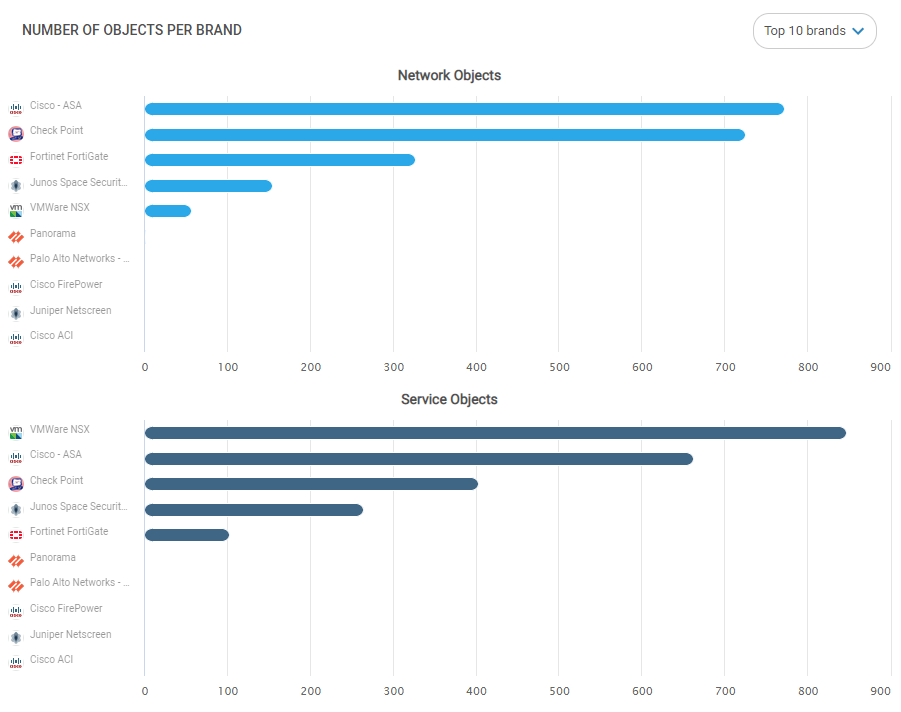
Number Of Objects Per Brand: You can select to see the top brands with the highest number of network security objects.
Click on the button the display 5 or 10 of the top brands.Click on a brand bar to open the Objects page, showing the list already filtered for the selected brand.
Clickable areas above these two main graphs show you:
-
Objects: The number of objects synced from ASMS, residing in the ObjectFlow database.
-
Open Change Requests: Displays the number of change requests that are currently in status open.
-
Duplicate Objects: Number of duplicate objects in system.
-
Unattached Objects: Number of unattached objects in system.

In addition you can:
-
Search using the Search Objects bar (see Search objects).
-
Create a new object by clicking +Create Object (see Create, edit and delete objects).

